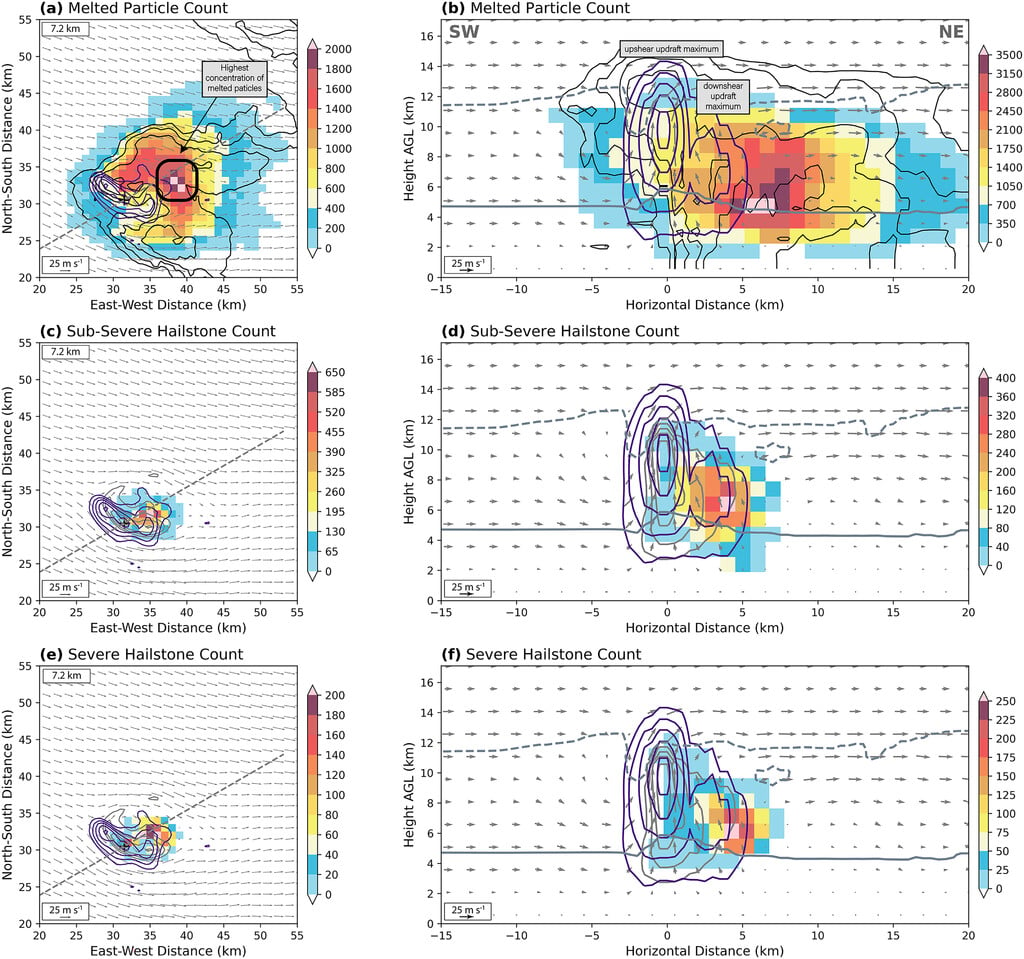
This study uses a new, unique dataset created by combining radar wind and reflectivity analysis and a complex hail trajectory model to create 2.7 million numerically simulated hail trajectories in the Kingfisher, Oklahoma, supercell thunderstorm on 29 May 2012. The hail trajectory model was designed by AER Senior Scientist Rebecca Adams-Selin in collaboration with co-author Conrad Ziegler of NSSL. A spatial integration technique considering all trajectories is used to identify locations within the supercell where melted particles and subsevere and severe hailstones reside in their lowest and highest concentrations. It is found that hailstones are more likely to reside for longer periods closer to the downshear updraft within the midlevel mesocyclone in a region of decelerated midlevel mesocyclonic horizontal flow, termed the downshear deceleration zone (DDZ). Additionally, clusters of trajectories are analyzed using a trajectory clustering method designed by co-author Adams-Selin. Trajectory clusters show there are many trajectory pathways that result in hailstones larger than 4.5 cm, including trajectories that begin upshear of the updraft away from ideal growth conditions and trajectories that grow within the DDZ. There are also trajectory clusters with similar shapes that experience widely different environmental and hailstone characteristics along the trajectory.

Figure (source figure 4, cited paper): Modeled concentrations of (a),(b) hail particles that completely melt above ground; (c),(d) subsevere hailstones that reach ground; and (e),(f) severe hailstones that reach ground in the Kingfisher storm at 2300 UTC. (left) Hailstone counts in a 1 km × 1 km grid cell in the x–y plane integrated through the full radar analysis domain depth. Ground relative horizontal in (a), (c), and (e) and horizontal along the cross section and vertical in (b), (d), and (f) wind vectors at 7.2 km (AGL) are denoted by the gray arrows. Black contours are reflectivity starting at 20 dBZ at 10-dBZ increments at 7.2 km in (a) and (b), and gray contours are qc starting at 2 g kg−1 in 2 g kg−1 intervals. Purple contours are vertical velocity starting at 10 m s−1 at 10 m s−1 increments at 7.2 km. A black “x” is shown where the maximum of the mean vertical velocity at all levels is found. A dashed black line denotes the cross section shown directly to the right of the panel. (right) Hailstone counts in a 1 km × 1 km grid cell in the corresponding cross section, where grid cells are horizontally integrated across the full radar analysis domain in the direction normal to the cross section. The dashed gray line indicates the −40°C level and the solid gray line indicates the 0°C level.
L. E. Pounds, C. L. Ziegler, R. D. Adams-Selin, M. I. Biggerstaff
Monthly Weather Review, 152, 245–276, 2024
https://doi.org/10.1175/MWR-D-23-0073.1

