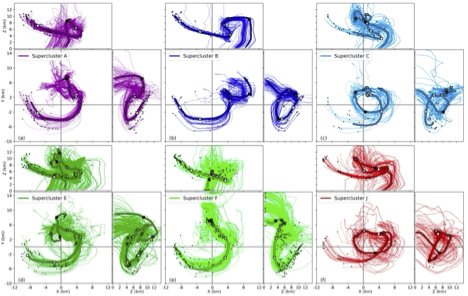
Current methods that incorporate synoptic, meso-alpha, and even some storm-scale processes to distinguish among storms that produce significantly severe versus merely severe hail have not been highly successful. These results suggest that smaller-scale processes, such as meso-beta, meso-gamma, and microscale, have a larger impact on hail production than previously theorized. Relatedly, previous research, often using hail trajectories driven by steady-state model fields, has also frequently painted hail having simple, relatively uniform motions within a supercell. This study, led by Dr. Adams-Selin of AER, uses a Lagrangian hail trajectory model embedded in two idealized supercell simulations and updated every model timestep, in conjunction with a trajectory clustering technique, to examine the variability of hail trajectories both within and across the two simulations.
The clustering method identified 11 distinct clusters in both supercell simulations. Clusters sourced embryos from almost all quadrants around the updraft core. Trajectories in both simulations exhibited complex and highly variable behavior, occasionally including multiple vertical loops. Cluster trajectories could follow similar paths but produce different distributions of mass at the surface, or conversely, could follow different paths but result in similar mass distributions at the surface. An aggregate review of all trajectories showed the larger hail in each simulation was somewhat more likely to be produced in regions with less strong peak updraft speeds, but other environmental profile information was more mixed, particularly for the simulation producing the largest hail. In sum, storm-scale information is highly impactful on hail trajectories, and needs to be considered in forecasting applications. Future hail trajectory modeling studies also need to incorporate more realistic storm-scale information.
 trajectories as
Figure: Six of the identified hail trajectory clusters in one of the supercell simulations. The thick line in each, outlined in black, is the representative trajectory of that cluster. All trajectories shown produced hail that reach the surface with diameters between 25 and 45 mm. Trajectories are shown in an updraft-relative framework with X=0, Y=0 km the center of the updraft core. Within the set of three plots that make up each subfigure, the top plot shows the trajectories projected onto a x-z vertical cross section, the bottom left plot a x-y plan view, and the bottom right a z-y vertical cross-section. Trajectory starting points are identified with small black circles. In the plan views, trajectory ending points have arrows. Grey-shaded squares along the representative trajectory represent 5-min time intervals, with darkest shaded square marking five minutes before the hailstone reached the surface, and shades getting progressively lighter.
Citation: The Quasi-stochastic Nature of Hail Growth: Hail Trajectory Clusters in Simulations of the Kingfisher, OK Hailstorm
R. Adams-Selin
Monthly Weather Review, Early On-line Releases, 2024
https://doi.org/10.1175/MWR-D-23-0233.1

