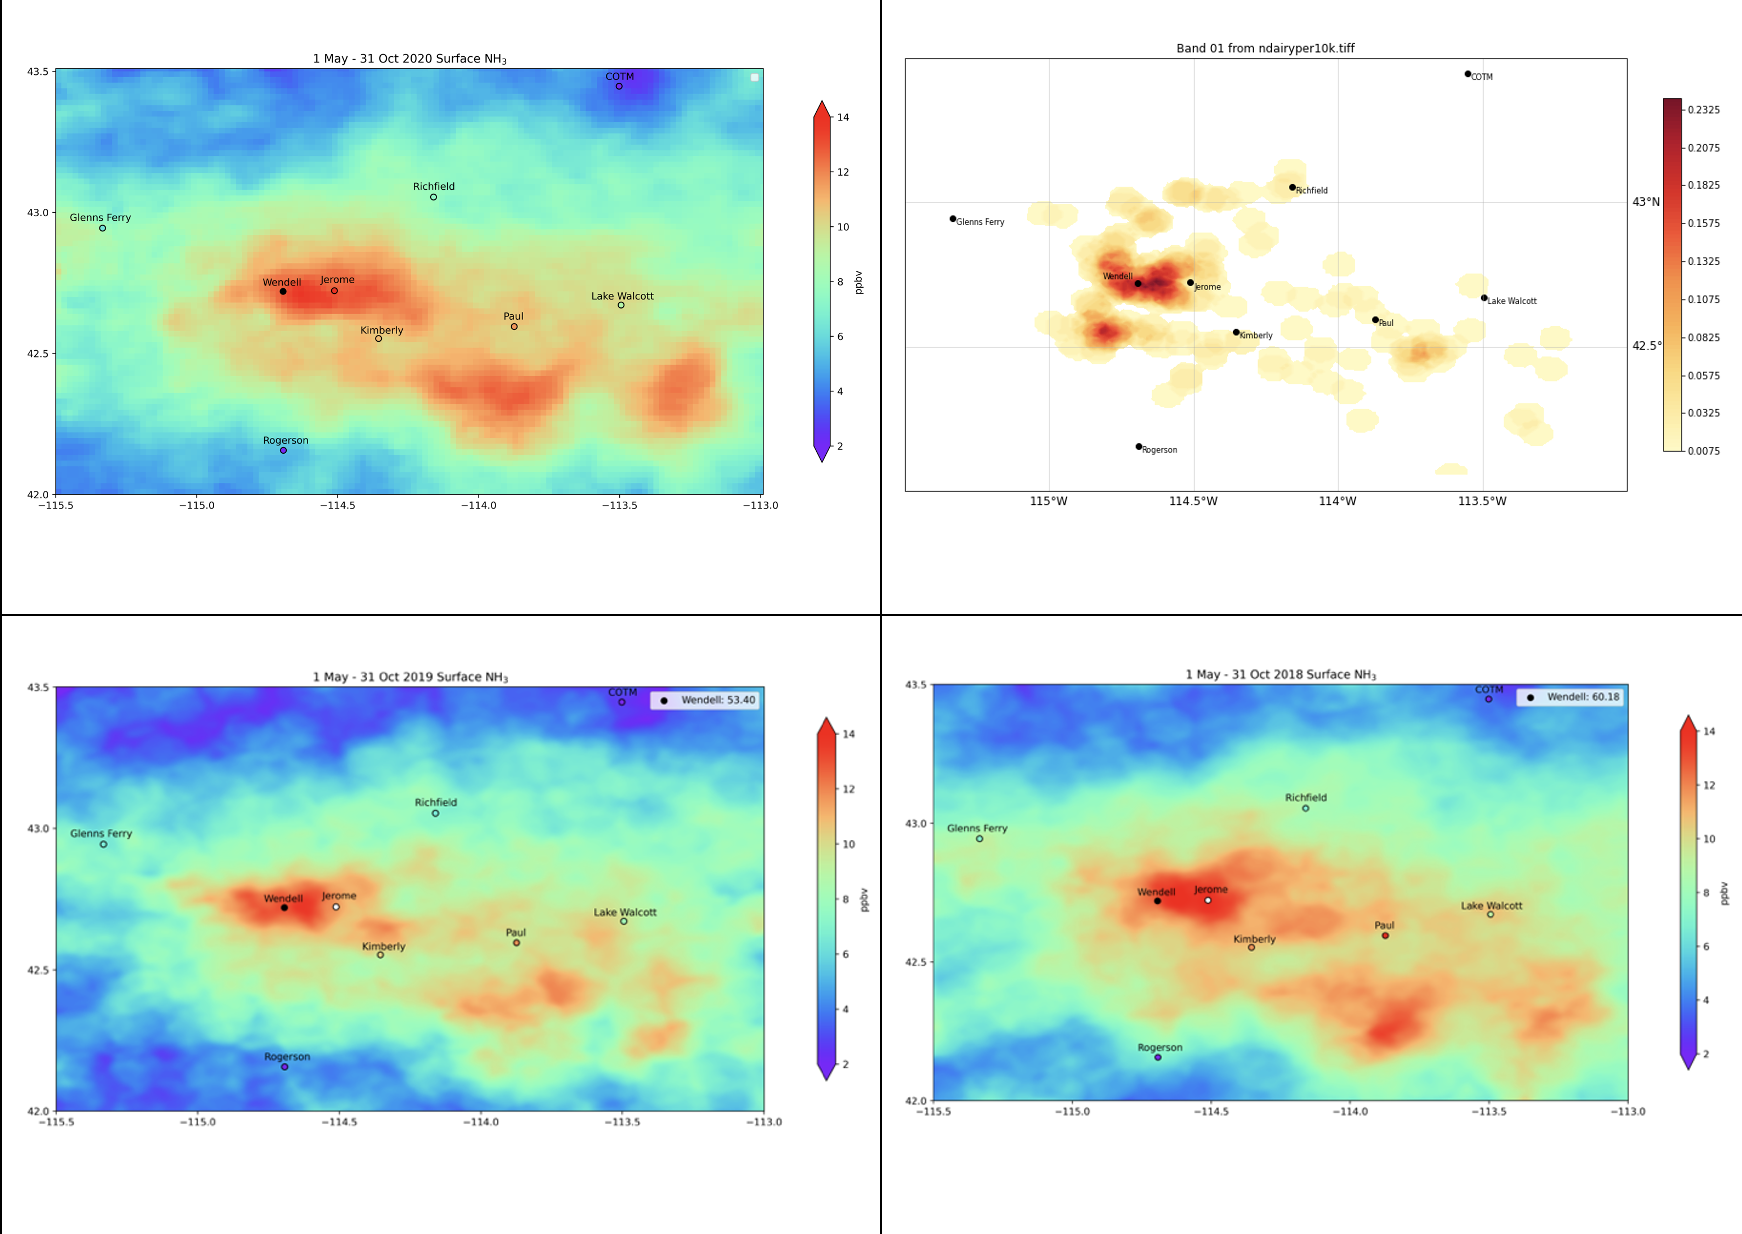
Ammonia is a highly reactive gas, and thus highly variable in space and time. In many regions, ammonia is a significant precursor of PM2.5 particles, aerosols that are smaller than 2.5 microns, which have deleterious effects on the human respiratory system, as they can penetrate deeply into the lungs. Ammonia emissions thus contribute to poor air quality. Furthermore, when ammonia is deposited to the soil or in the water, it disrupts ecosystem equilibrium, leading to problems such as algal blooms. Yet in spite of these adverse effects, ammonia concentrations are rising, due to the increase of large scale, intensive agricultural activities, which are often accompanied by greater use of fertilizers and concentrated animal feedlots, leading to increased ammonia emissions. However, ammonia is difficult to measure, and monitoring networks are generally sparse. Satellite based instruments, such as the Atmospheric Infrared Sounder (AIRS), and the Cross-Track Infrared Sounder (CrIS), have been shown to provide much greater temporal and spatial coverage of ammonia distribution and variability than is possible with in situ networks or aircraft campaigns, but the validation of these data is limited. In a recent peer-reviewed study, led by AER Principal Scientist Karen Cady-Pereira, ammonia retrievals from AIRS and CrIS were validated against ammonia measurements from aircraft in the California Central Valley and in the Colorado Front Range. These are small datasets taken over high source regions under very different conditions: winter in California and summer in Colorado. Direct comparisons of the surface values of the retrieved profiles are biased very low in California (~40 ppbv) and slightly high in Colorado (~10 ppbv). This bias appears to be primarily due to smoothing error, since applying the instrument operator effectively reduces the bias to zero; even after the smoothing error is accounted for, the average uncertainty is in the 20-30% range. They also compared three years of CrIS ammonia against an in situ network in the Magic Valley in Idaho. This analysis showed that CrIS ammonia captures both the seasonal signal and the spatial variability in the Magic Valley, though it is biased low here also. In summary, this analysis substantially adds to the validation record but also points to the need for more validation under many different conditions and at higher altitudes.

Figure: CrIS surface NH3 data from the May–October period oversampled onto a 0.002 grid for each of 3 years: 2020 (upper left), 2019 (lower left), 2018 (lower right); number of dairies per square kilometer (upper right).
K. E. Cady-Pereira, X. Gao, R. Wang, A. B. Leytem, C. Calkins, E. Berry, K. Sun, M. Müller, A. Wisthaler, V. H. Payne, M. W. Shephard, M. A. Zondlo, V. Kantchev
Atmos. Meas. Tech., 17, 15–36, 2024
https://doi.org/10.5194/amt-17-15-2024

