July 24, 2024
Dr. Judah Cohen from Atmospheric and Environmental Research (AER) embarked on an experimental process of regular research, review, and analysis of the Arctic Oscillation (AO) and Polar Vortex (PV). This analysis is intended to provide researchers and practitioners real-time insights on one of North America’s and Europe’s leading drivers for extreme and persistent temperature patterns.
During the winter schedule the blog is updated once every week. Snow accumulation forecasts replace precipitation forecasts. Also, there is renewed emphasis on ice and snow boundary conditions and their influence on hemispheric weather. In late Spring, we transition to a spring/summer schedule, which is once every two weeks. Snow accumulation forecasts will be replaced by precipitation forecasts. Also, there will be less emphasis on ice and snow boundary conditions and their influence on hemispheric weather
Subscribe to our email list or follow me on Twitter (@judah47) for notification of updates.
The AO/PV blog is partially supported by NSF grant AGS: 1657748.
Summary
- The Arctic Oscillation (AO) is currently positive and is predicted to remain mostly positive the next two weeks as pressure/geopotential height anomalies across the Arctic are currently mostly negative and are predicted to remain mostly negative for the foreseeable future. The North Atlantic Oscillation (NAO) is currently positive with negative pressure/geopotential height anomalies across Greenland and the NAO is predicted to persist negative the next two weeks as pressure/geopotential height anomalies are predicted to remain negative across Greenland also for the foreseeable future.
- Over the next two weeks general troughing/negative geopotential height anomalies across Greenland will support ridging/positive geopotential height anomalies across much of Europe. However, the troughing/negative geopotential height anomalies across Greenland will extend to over Northwestern Europe for much of the next two weeks. This pattern will support the next two weeks normal to above normal temperatures across much of Europe with the exception of normal to below normal temperatures across Northwestern Europe including the including the United Kingdom (UK).
- The general pattern predicted for Asia the next two weeks is ridging/positive geopotential height anomalies centered over the Barents-Kara Seas forcing troughing/negative geopotential height anomalies across Western Asia and Northeastern Siberia with more ridging/positive geopotential height anomalies across Central Asia. This pattern favors the next two weeks normal to above normal temperatures across much of Asia centered on Northwestern China and Eastern Kazakhstan with normal to below normal temperatures across Western Asia and Northeastern Siberia.
- The next two weeks North America is predicted to be dominated by ridging/positive geopotential height anomalies with the exceptions of troughing/negative geopotential height anomalies across the Eastern United States (US) this week and Alaska next week. This pattern favors normal to above normal temperatures across much of Canada and the US the next two weeks with the exceptions of normal to below normal temperatures across the Eastern US this week and Alaska and far northwestern Canada next week.
- In the Impacts section I discuss the summer pattern across the Northern Hemisphere (NH) and what I expect for the month of August.
Plain Language Summary
Record heat in the Western US with cooler in the Eastern US and Northern Europe should continue this week (see Figure 3). However next week the weather should heat up once again (e.g., Figure 6). Overall looks like a warm pattern for the Western and Eastern US or “what you see is what you get.” Meanwhile I am less certain about temperatures in the Plains. But overall looks warm the US and for much of Europe.
Impacts
I have discussed often this summer about the strongly positive polar cap geopotential height anomalies (PCHs) associated in the stratosphere. When they descend all the way to the surface it is related to high latitude blocking and cooler temperatures in the Eastern US and Northern Europe. But when the warm/postive PCHs retreat higher into the troposphere this creats a vacuum for cold/negative PCHs to dominate the lower troposphere. The dominance of cold/negative PCHs to dominate the lower troposphere and positive AO regime has allowed for ridging to spread across the Eastern US and most of Europe except for far Western Europe this sumer. I do winder if there is a bug in the code that exaggerates the magnitde of the positive anomalies and I am checking it out. Still I think if the warm/postive PCHs reach the surface or not seems to be correct.
We did have one recent episode where the warm/postive PCHs reached the surface and high latitude blocking with cooler weather in the Eastern US and Northern Europe. But this episode is winding down and I expect a retturn to ridging and above nrmla temperatures for the foreseeable future. But certainly there is always the possibility of that the warm/postive PCHs will once again reach the surface, favoring high latitude blocking and cooler temperatures in the Eastern US and/or Northern Europe sometime in August.
In the meantime the observed surface temperature anomalies so far this summer are predominantly positive across the Northern Hemisphere continents with the exceptions of Central Canda and the US, Northwest Europe and Eastern Siberia (see Figure i). Across Eurasia, I do feel that the AER model is performing well with the summer forecast. One error are the predicted cool temperatures in Central Asia, but I think that is an error inherent in the NCEP/NCAR reanalysis and should be ignored.
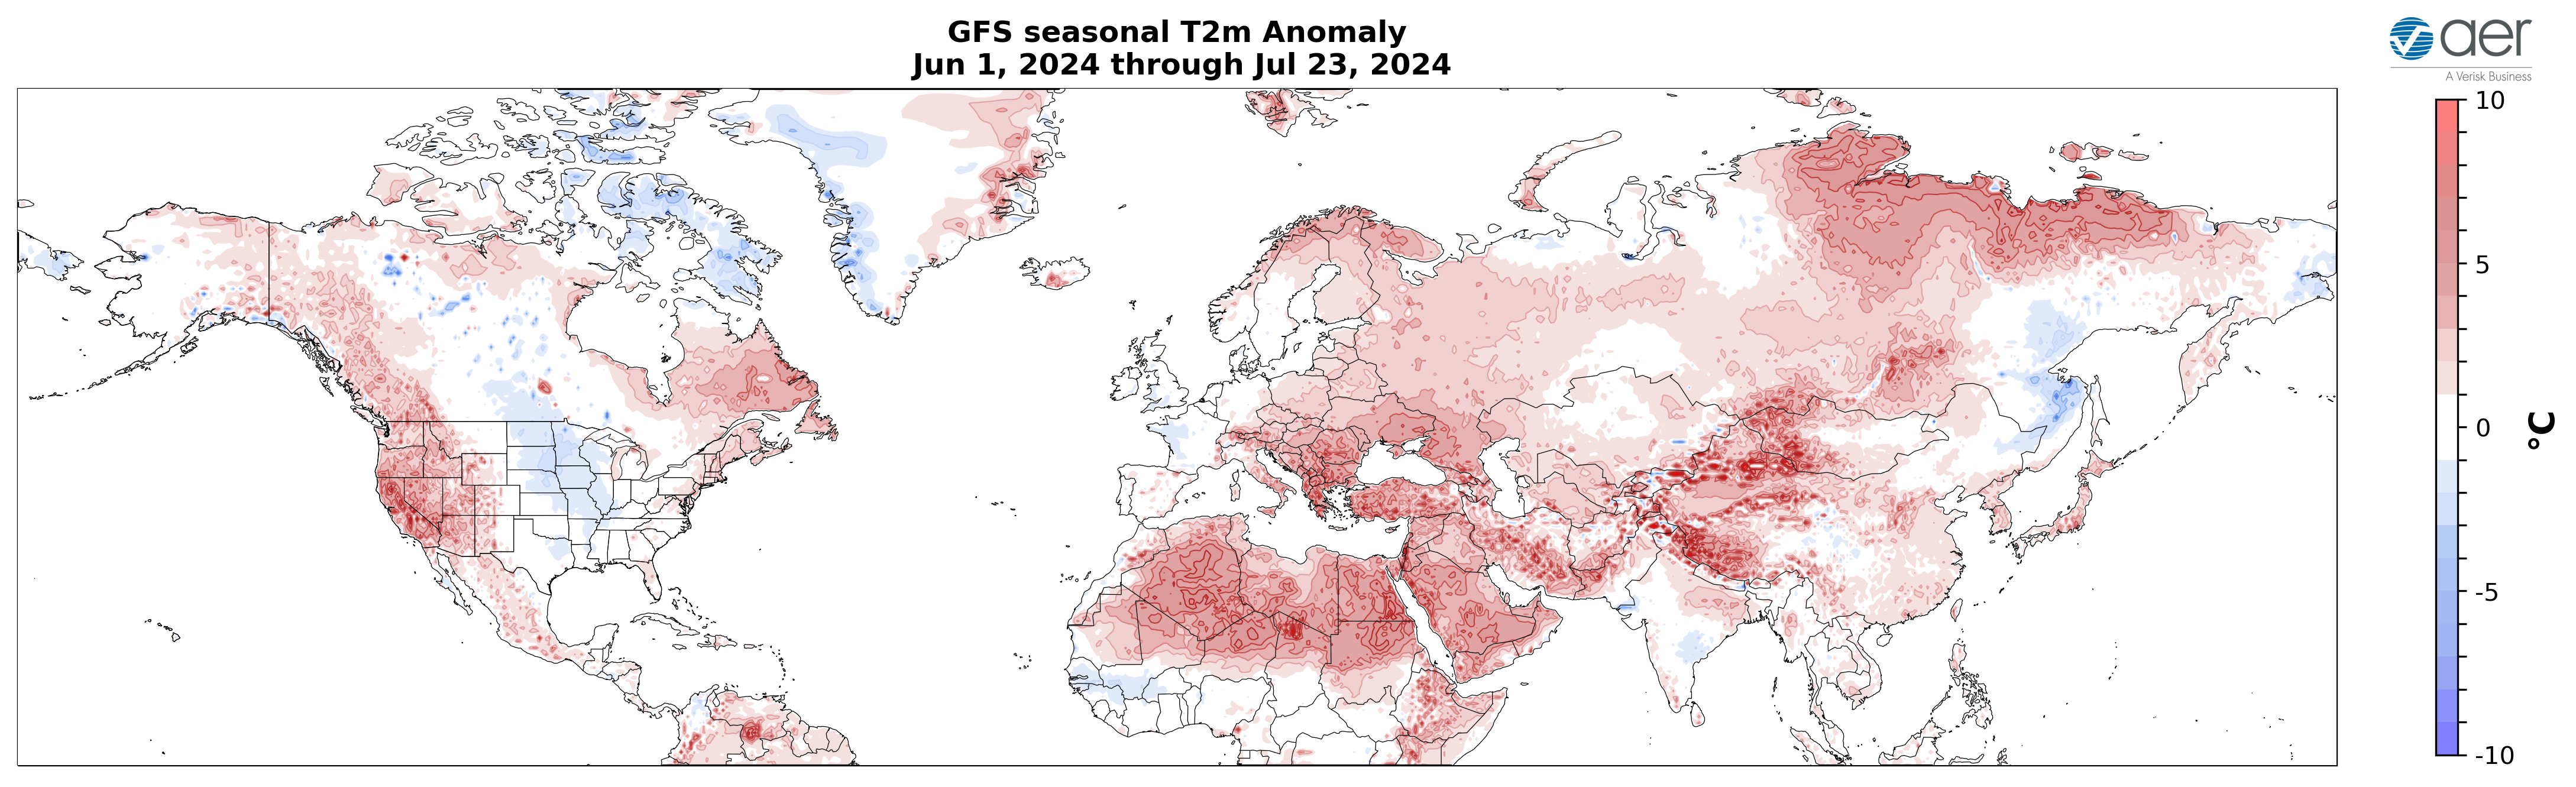
Figure i. Observed surface temperature anoamlies 1 June – 23 July 2024 (°C; shading). Computed from GFS initialized forecasts.
Across North Ameirca, a muti decadal trend forecast would have performed better with the largest positive departures across western North America but also very arm across eastern North America and cooler or even cool temperarues in the interior of Canada and the US. Seems reasonable to expect “what you see is what you’ll get” for the remainder of the summer.
The epsisode of high latitude blocking did acclerate Arctic sea ice melt. But should slow down again with the return of low pressure dominanace across the Arctic.
Near-Term
This week
the AO is predicted to be positive this week (Figure 1) with mostly negative geopotential height anomalies across the Arctic and with mixed geopotential height anomalies across the mid-latitudes of the NH (Figure 2). With predicted negative geopotential height anomalies across Greenland (Figure 2), the NAO is predicted to be positive this week.
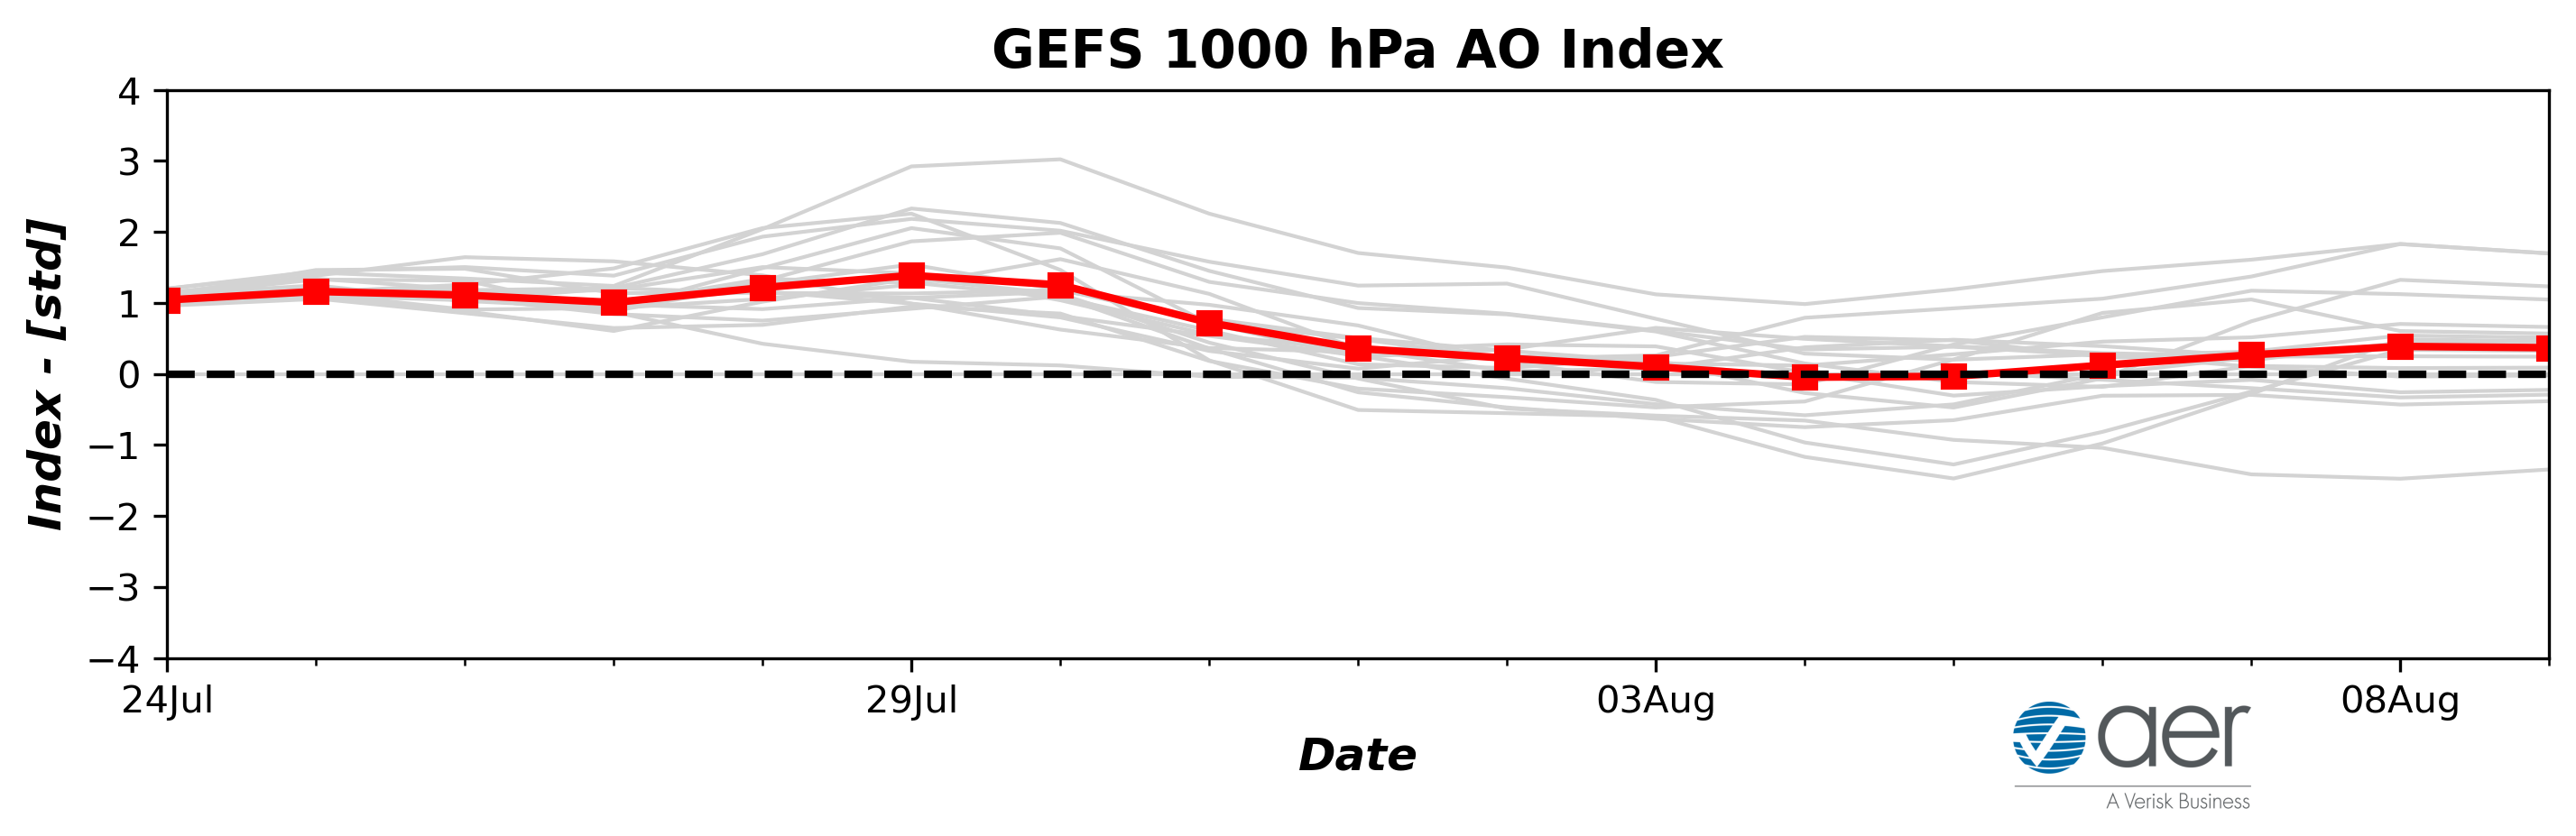
Figure 1. The predicted daily-mean AO at 1000 hPa from the 00Z 24 July 2024 2024 GFS ensemble. Gray lines indicate the AO index from each individual ensemble member, with the ensemble-mean AO index given by the red line with squares.
This week, troughing/negative geopotential height anomalies across Greenland will extend east into Northwestern Europe with ridging/positive geopotential height anomalies dominating the rest of Europe this week (Figures 2). This pattern favors normal to above normal temperatures across much of Europe with the exception of normal to below normal temperatures across Northern and Western Europe including the UK (Figure 3). This week the predicted pattern across Asia is ridging/positive geopotential height anomalies centered in the Barents-Kara Seas forcing troughing/negative geopotential height anomalies to the south across Western Asia and to the east across Northeastern Siberia with more ridging/positive geopotential height anomalies centered across Central Asia (Figure 2). This pattern favors normal to above normal temperatures across much of Asia but especially across Northwestern China and Eastern Kazakhstan with normal to below normal temperatures across Western Russia, Western Kazakhstan and Northeastern Siberia (Figure 3).
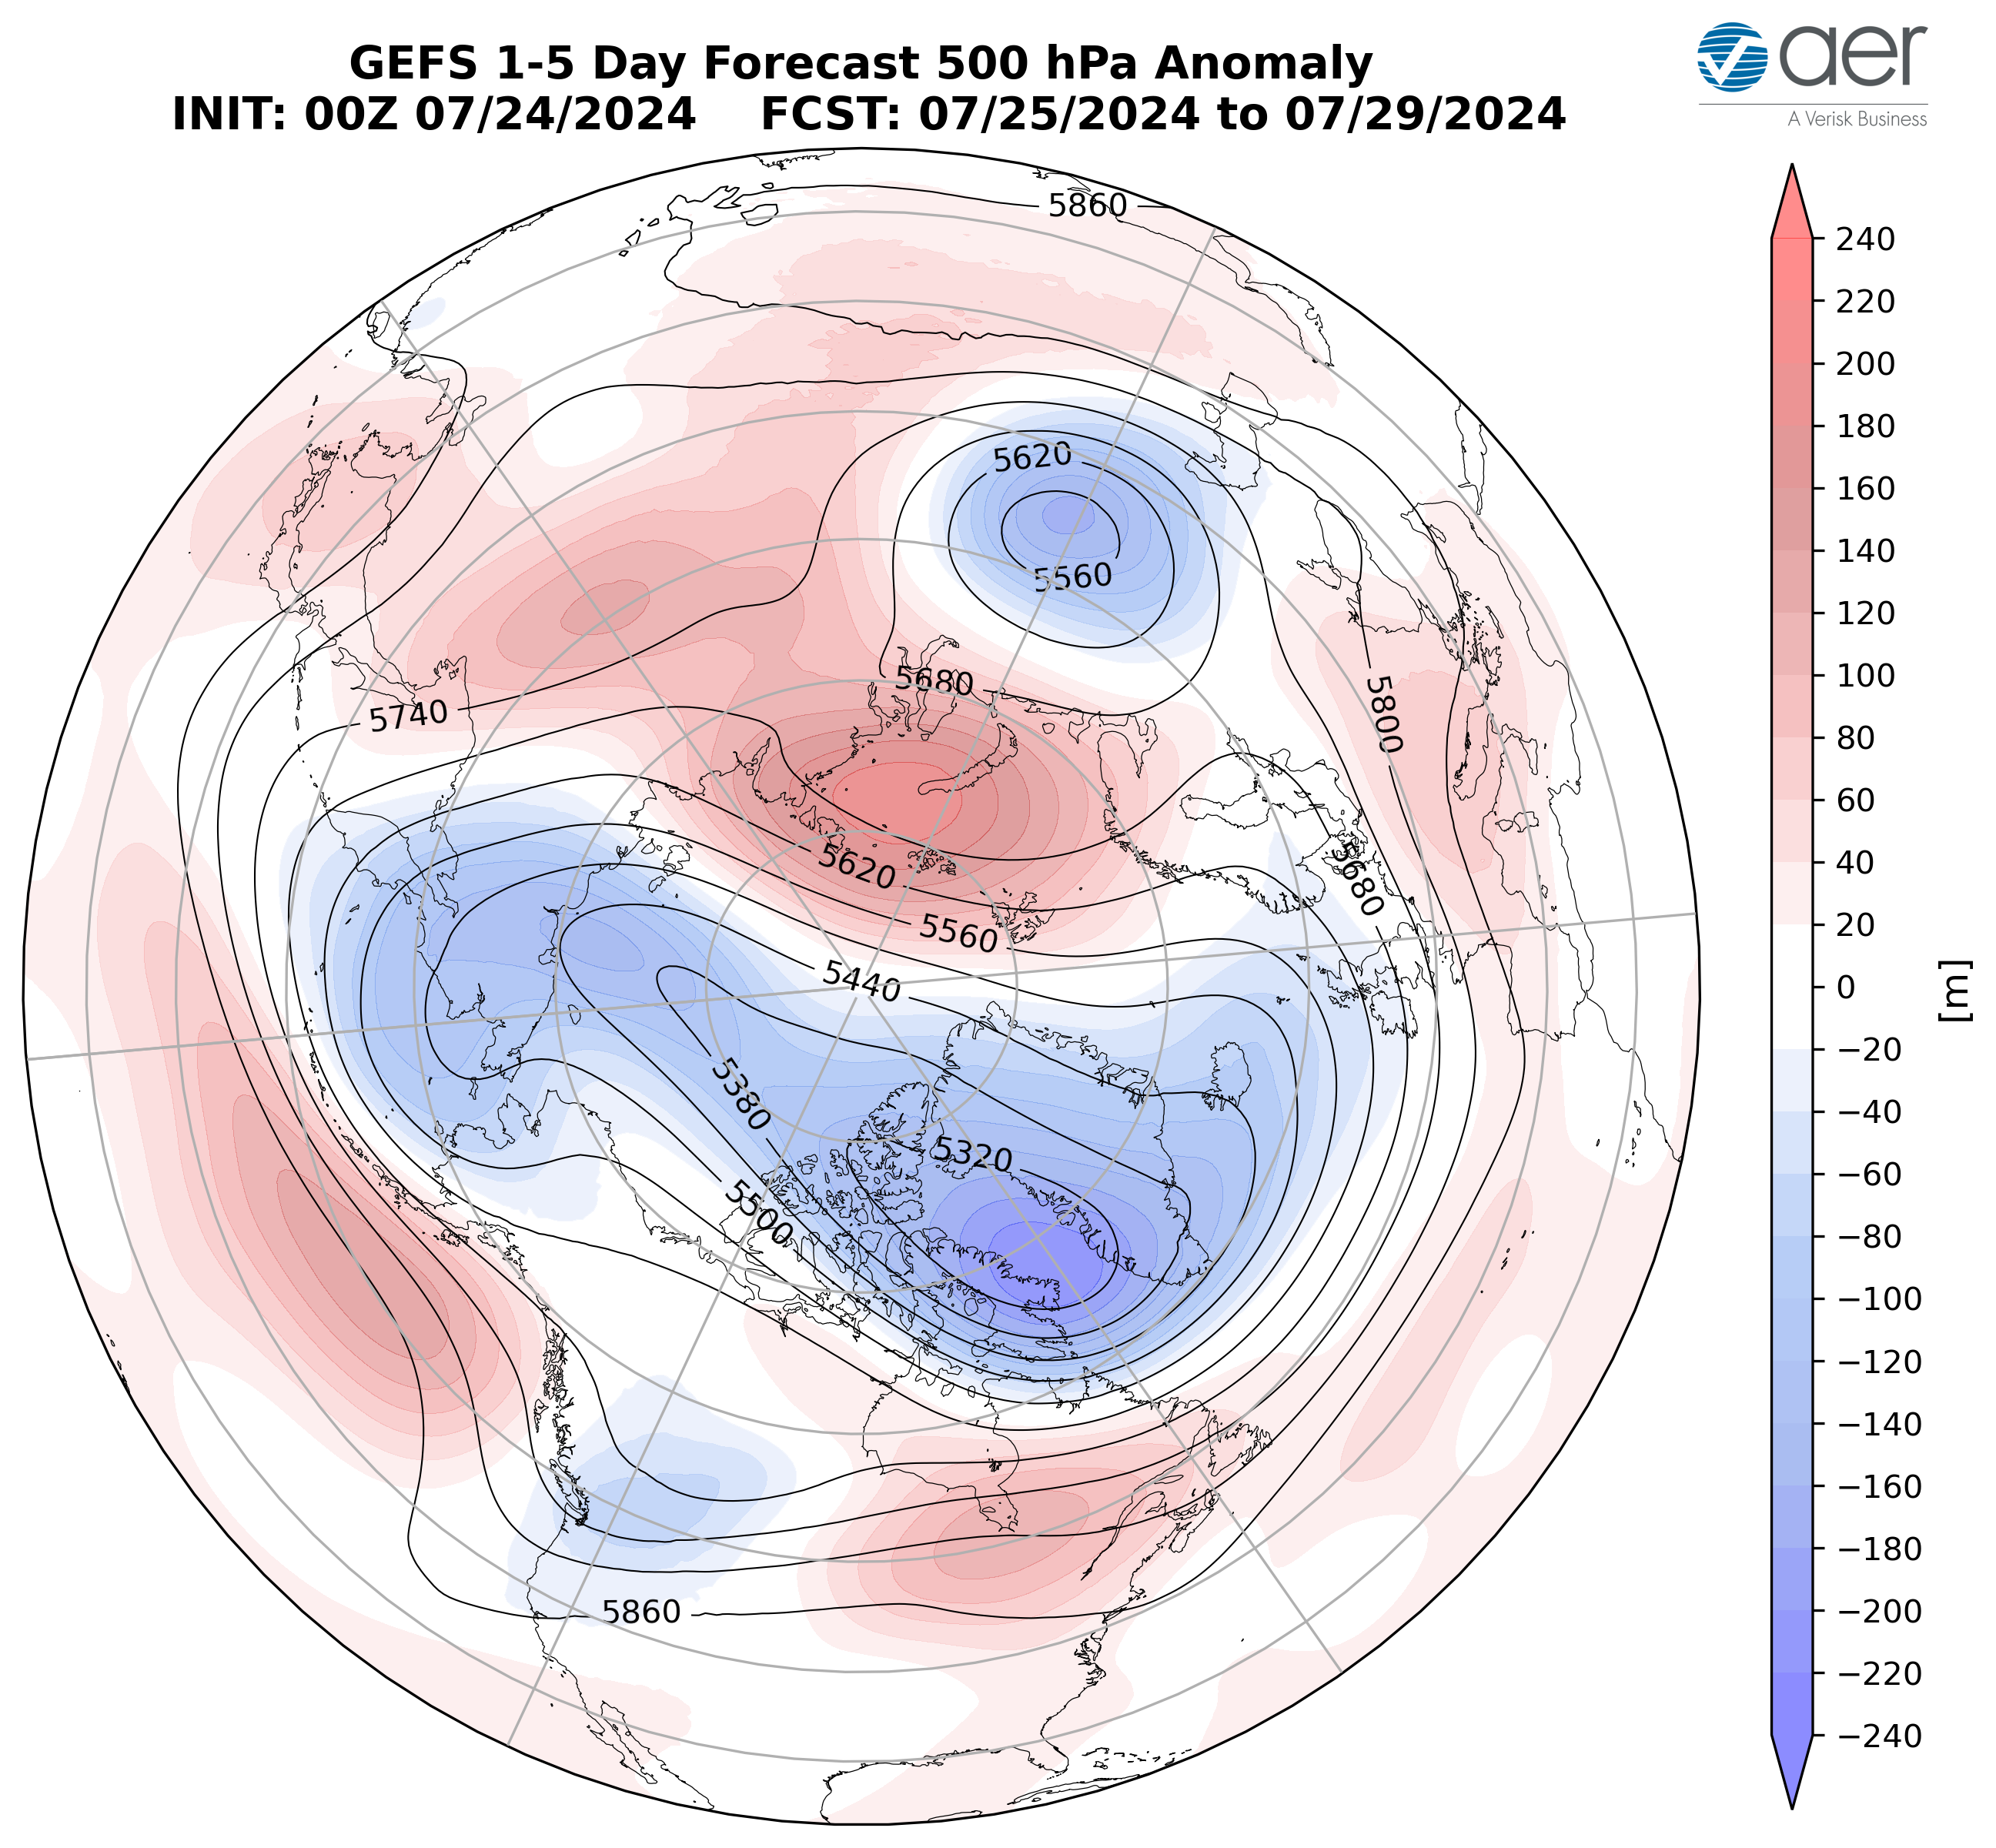
Figure 2. Forecasted average 500 mb geopotential heights (dam; contours) and geopotential height anomalies (m; shading) across the Northern Hemisphere from 25 – 29 July 2024. The forecasts are from the 00z 24 July 2024 2024 GFS ensemble.
This week ridging/positive geopotential height anomalies are predicted to Canada and the US with the exception of troughing/negative geopotential height across the Eastern US (Figure 2). This pattern will favor normal to above normal temperatures across Alaska, Canada, and the Western and Central US with normal to below normal temperatures mostly limited to the Eastern US (Figure 3).
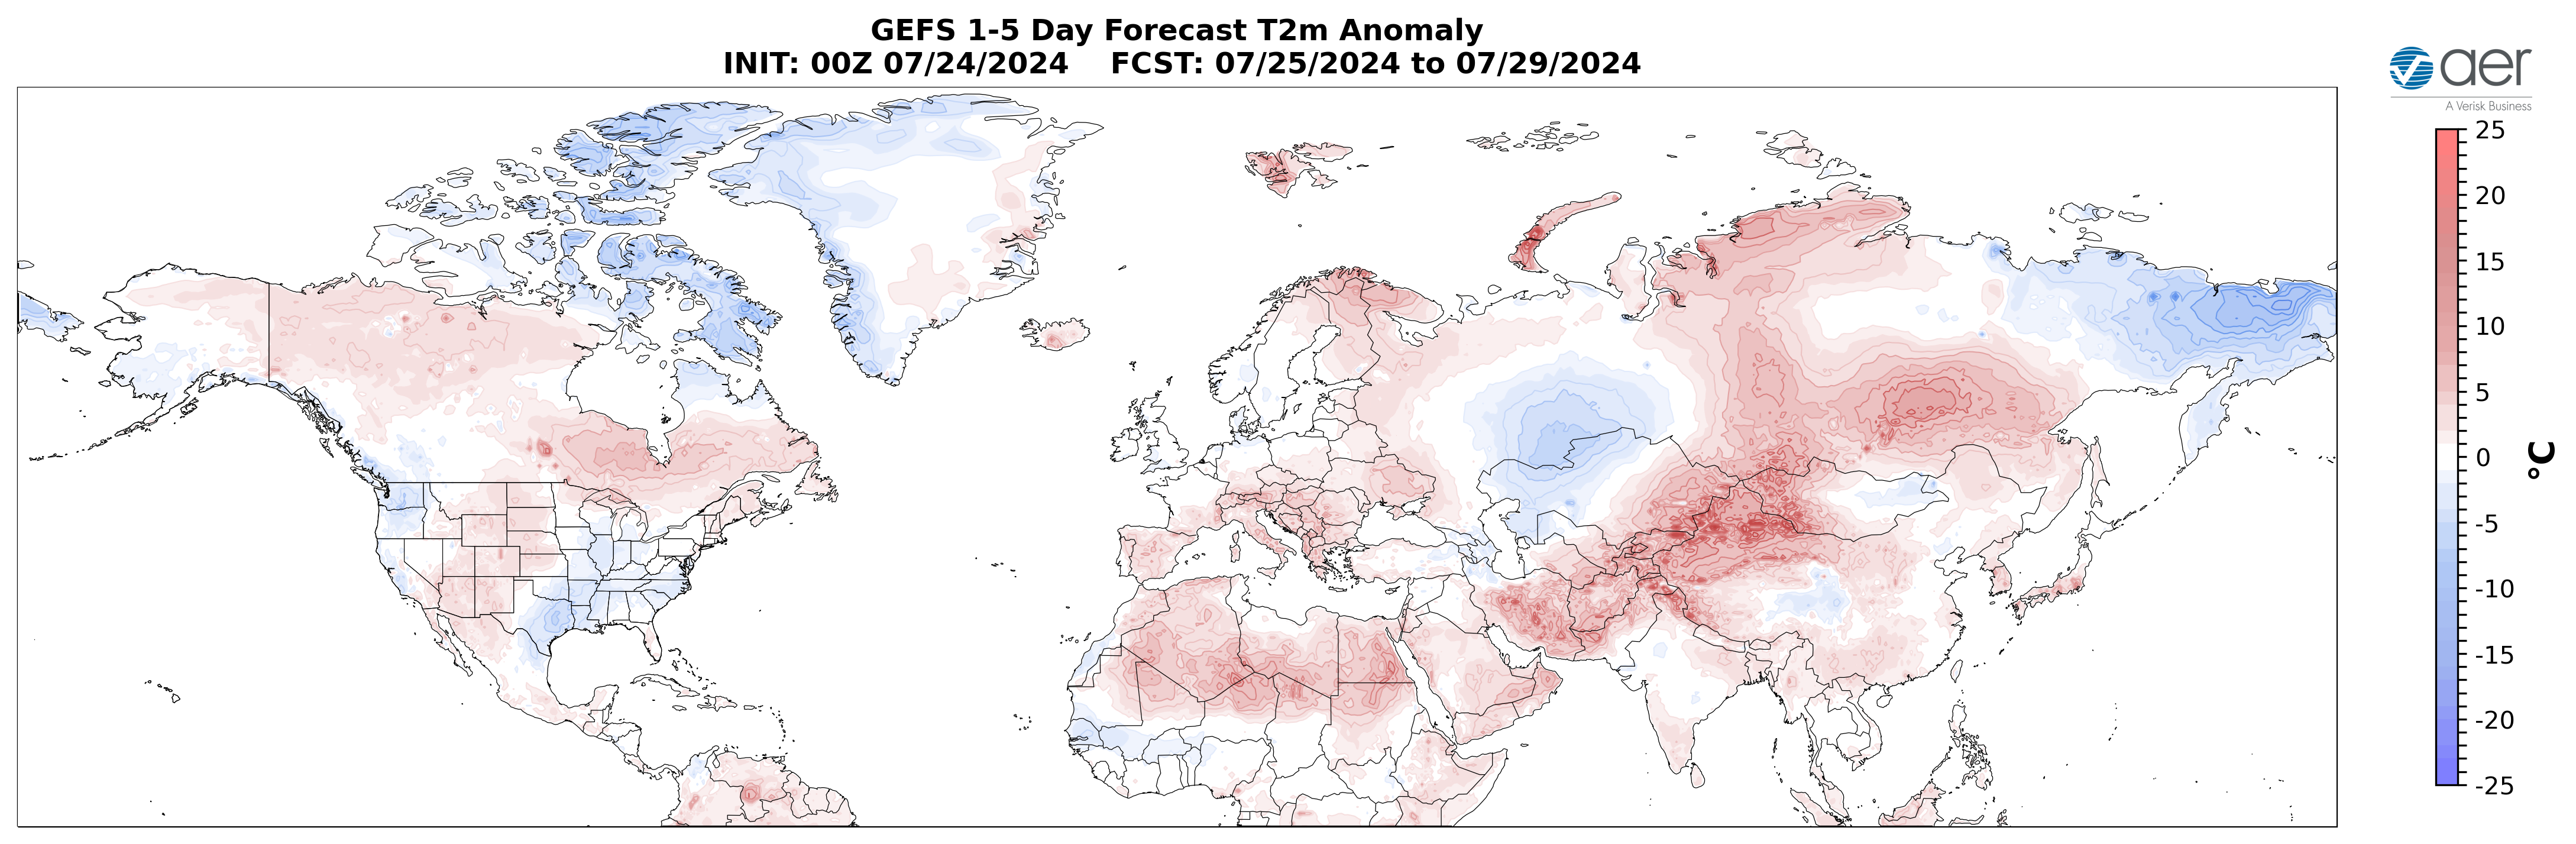
Figure 3. Forecasted surface temperature anomalies (°C; shading) from 25 – 29 July 2024. The forecast is from the 00Z 24 July 2024 2024 GFS ensemble.
Troughing will support above normal rainfall across Scandinavia, Western Russia, the Tibetan Plateau and parts of Northeast Asia with normal to below normal rainfall elsewhere across Eurasia this week (Figure 4). Troughing will support above normal rainfall across the Western Alaska, Western Canada and the Southeastern US with normal to below normal rainfall across the remainder of North America this week (Figure 4).
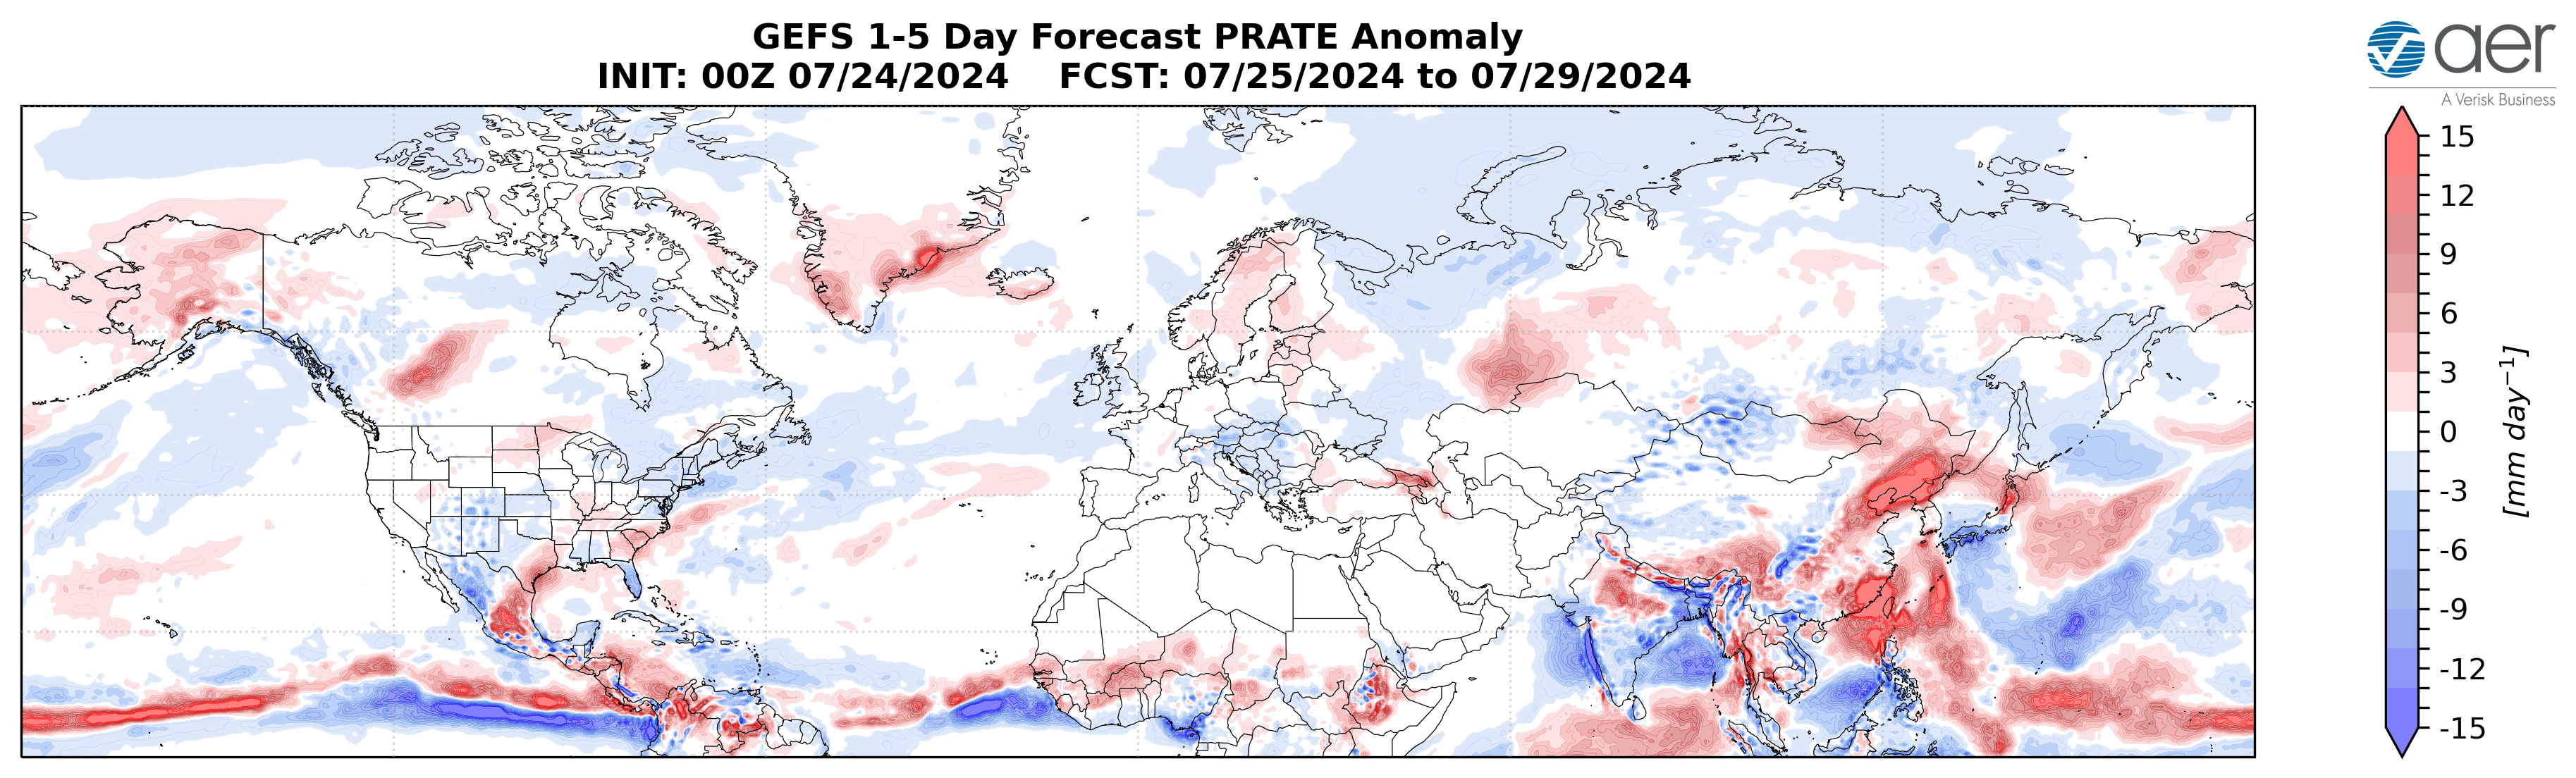
Figure 4. Forecasted precipitation anomalies (mm/day; shading) from 25 – 29 July 2024. The forecast is from the 00Z 24 July 2024 2024 GFS ensemble.
Near-Mid Term
Next week
With geopotential height anomalies remaining mostly negative across the Arctic and with mixed geopotential height anomalies across the mid-latitudes this period (Figure 5), the AO will likely continue to be positive this period (Figure 1). With predicted negative pressure/geopotential height anomalies across Greenland (Figure 5), the NAO will likely be positive this period as well.
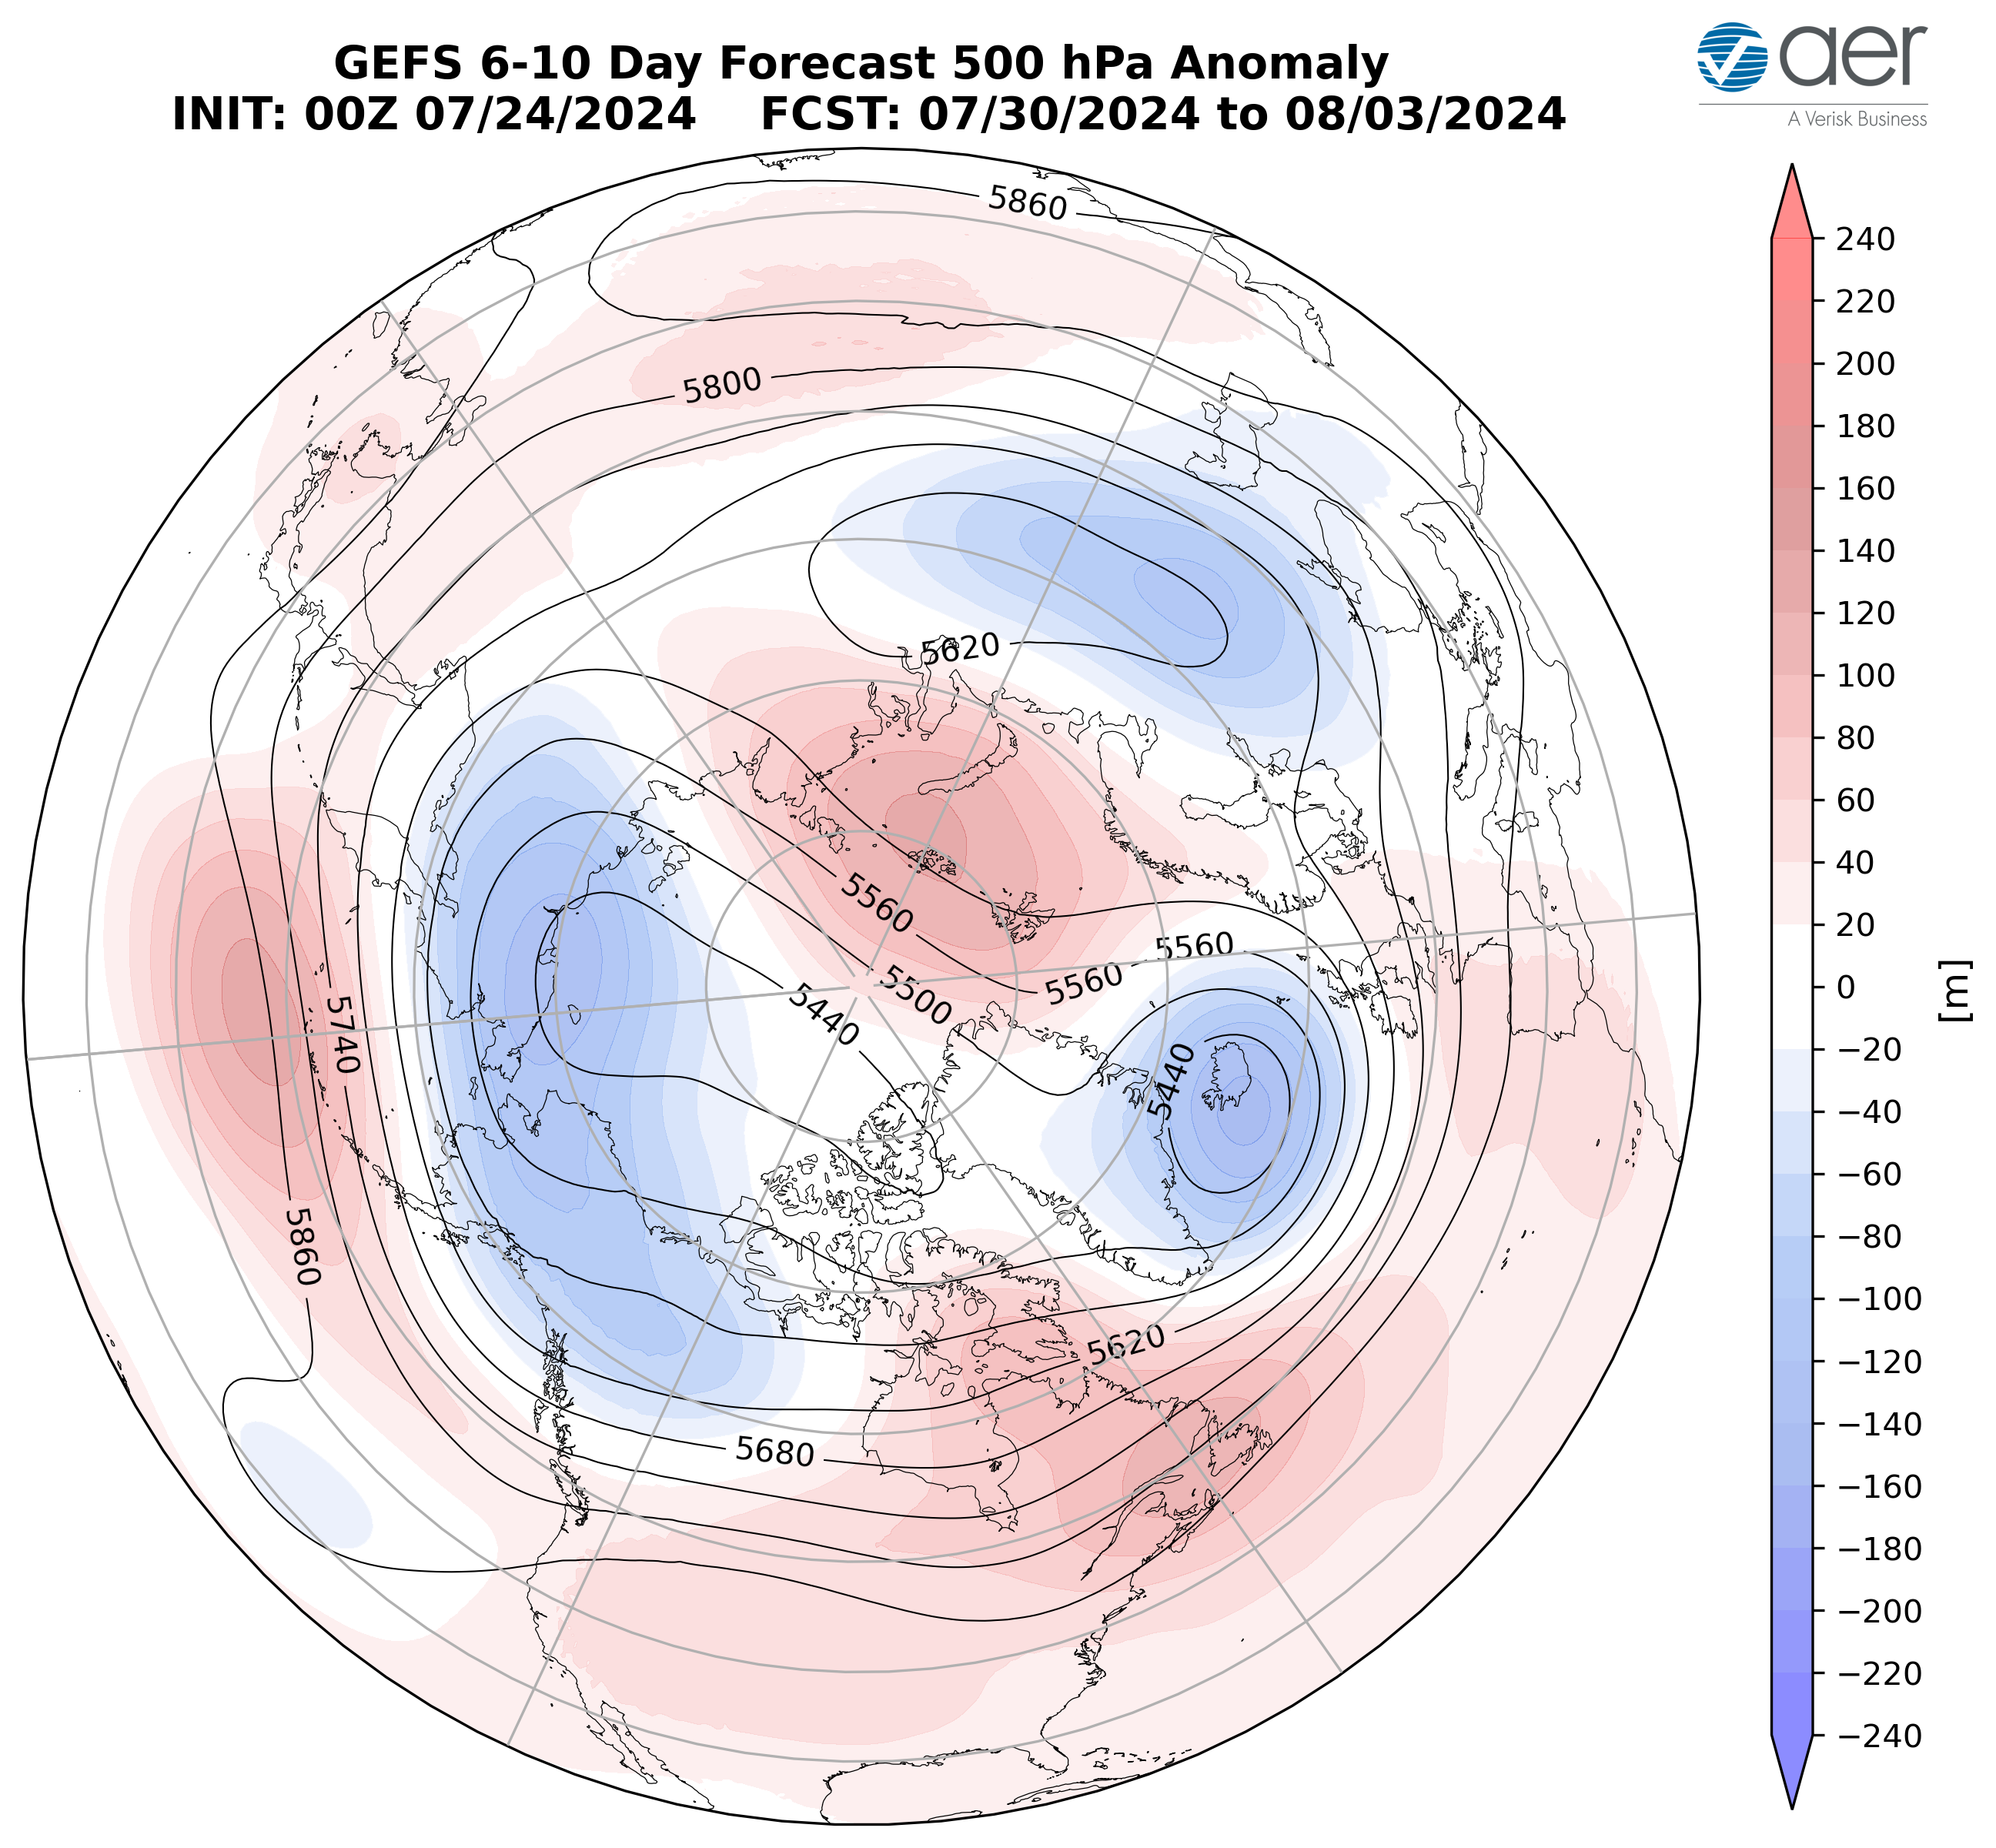
Figure 5. Forecasted average 500 mb geopotential heights (dam; contours) and geopotential height anomalies (m; shading) across the Northern Hemisphere from 24 July – 3 August 2024. The forecasts are from the 00z 24 July 2024 2024 GFS ensemble.
Persistent troughing/negative geopotential height anomalies across Greenland will continue to support ridging/positive geopotential height anomalies across much of Europe with the exception troughing/negative geopotential height anomalies across Western Russia expanding west into the Baltic States this period (Figure 5). This pattern will favor normal to above normal temperatures across most of Europe including the UK with the exception of normal to below temperatures across the Baltic States (Figures 6). The pattern of ridging/positive geopotential height anomalies centered in the Barents-Kara Seas forcing troughing/negative geopotential height anomalies to the south across Western Asia and to the east across Northeastern Siberia with more ridging/positive geopotential height anomalies centered across Central Asia is predicted to continue this period (Figure 5). This pattern favors normal to above normal temperatures widespread across Asia but especially across Northwestern China and Eastern Kazakhstan with normal to below normal temperatures across Western Russia, Western Kazakhstan and Northeastern Siberia this period (Figure 6).
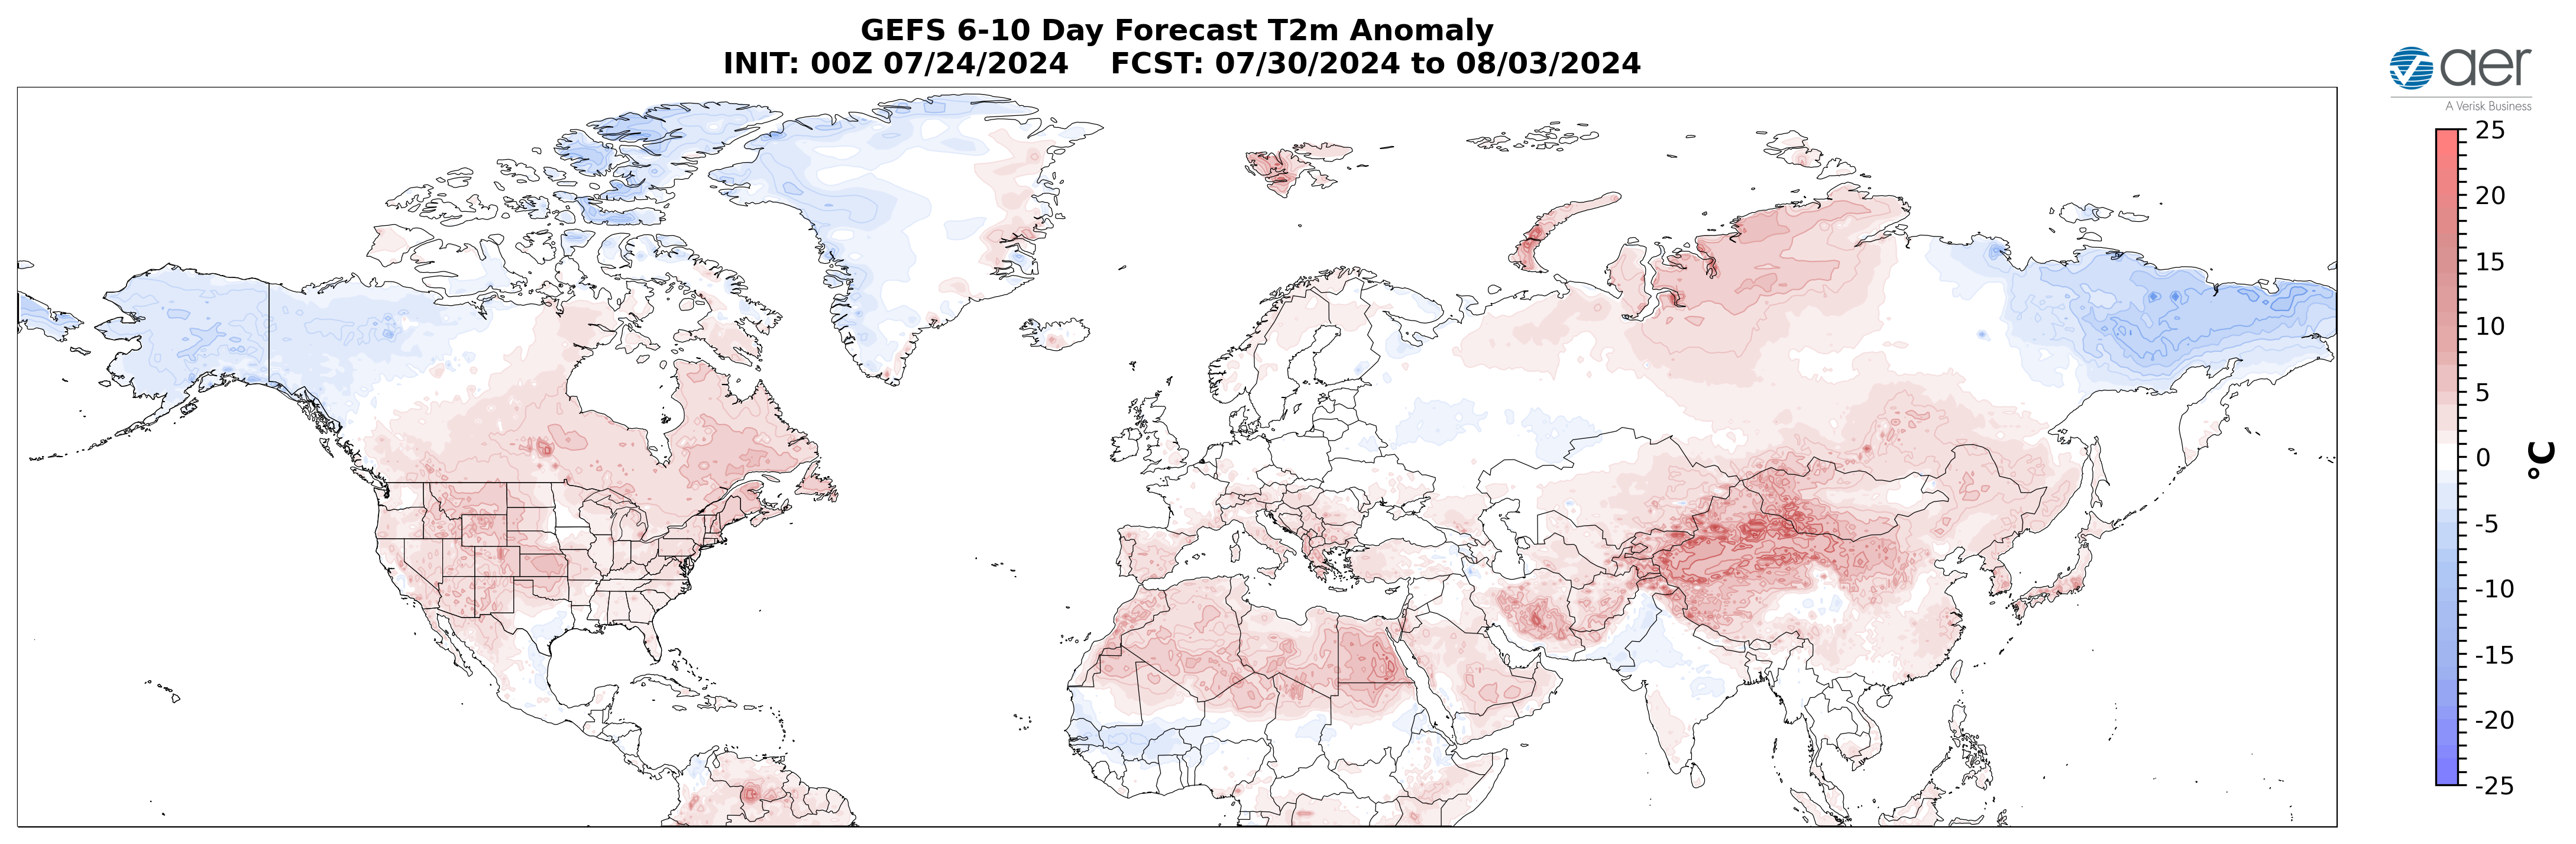
Figure 6. Forecasted surface temperature anomalies (°C; shading) from 24 July – 3 August 2024. The forecasts are from the 00z 24 July 2024 2024 GFS ensemble.
Ridging/positive geopotential height anomalies are predicted to dominate much of Canada and the US with the exception of troughing/negative geopotential height anomalies across Alaska this period (Figure 5). This pattern favors normal to above normal temperatures across much of Canada and the US with normal to below normal temperatures mostly limited to Alaska and Northwestern Canada (Figure 6).
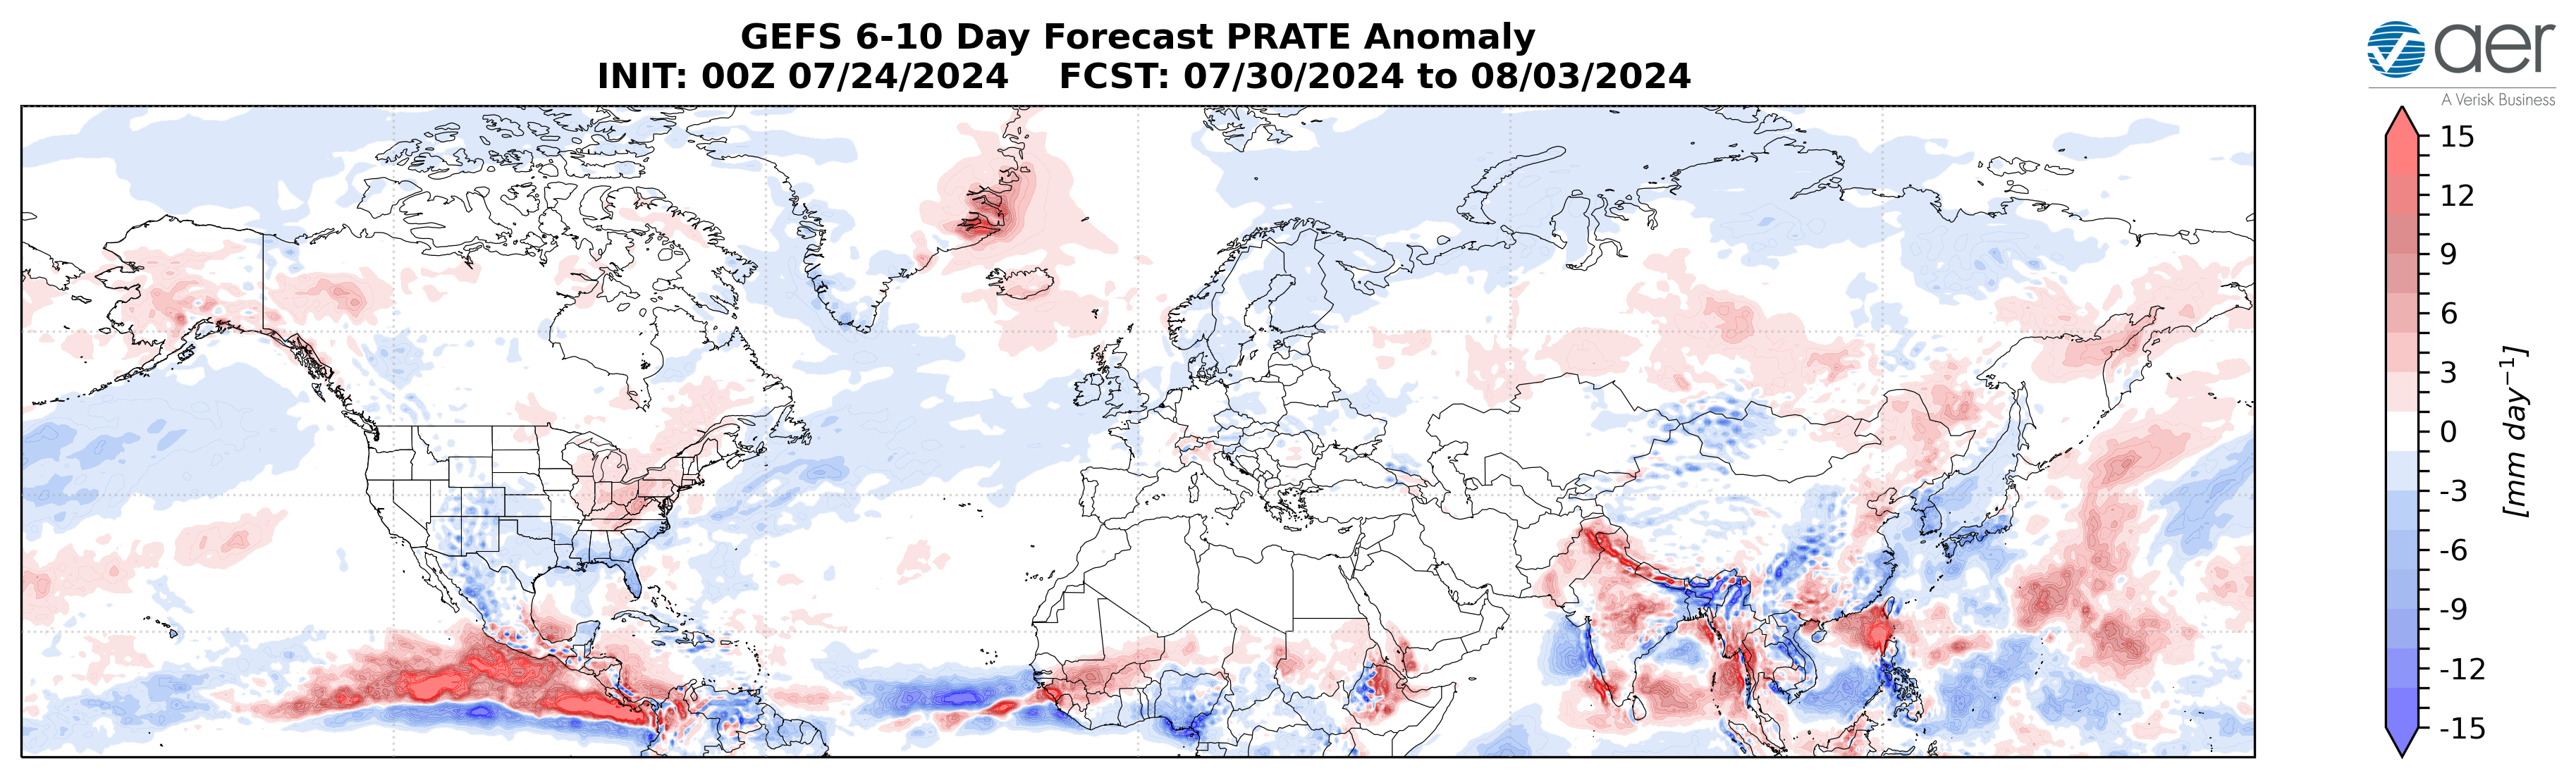
Figure 7. Forecasted precipitation anomalies (mm/day; shading) from 24 July – 3 August 2024. The forecast is from the 00Z 24 July 2024 2024 GFS ensemble.
Troughing will support above normal rainfall across Southern Siberia, the Tibetan Plateau, northern India and parts of East Asia with normal to below normal rainfall elsewhere across Eurasia this period (Figure 7). Troughing will support above normal rainfall across Alaska, Northwest Canada, the US Great Lakes into southern Quebec and the Northeastern US with normal to below normal rainfall across the rest of North America this period (Figure 7).
Mid Term
Week Two
With predicted mostly negative geopotential height anomalies across the Arctic and mixed geopotential height anomalies across the mid-latitudes this period (Figure 8), the AO will likely persist positive this period (Figure 1). With predicted negative pressure/geopotential height anomalies across Greenland (Figure 8), the NAO will likely be positive as well this period.
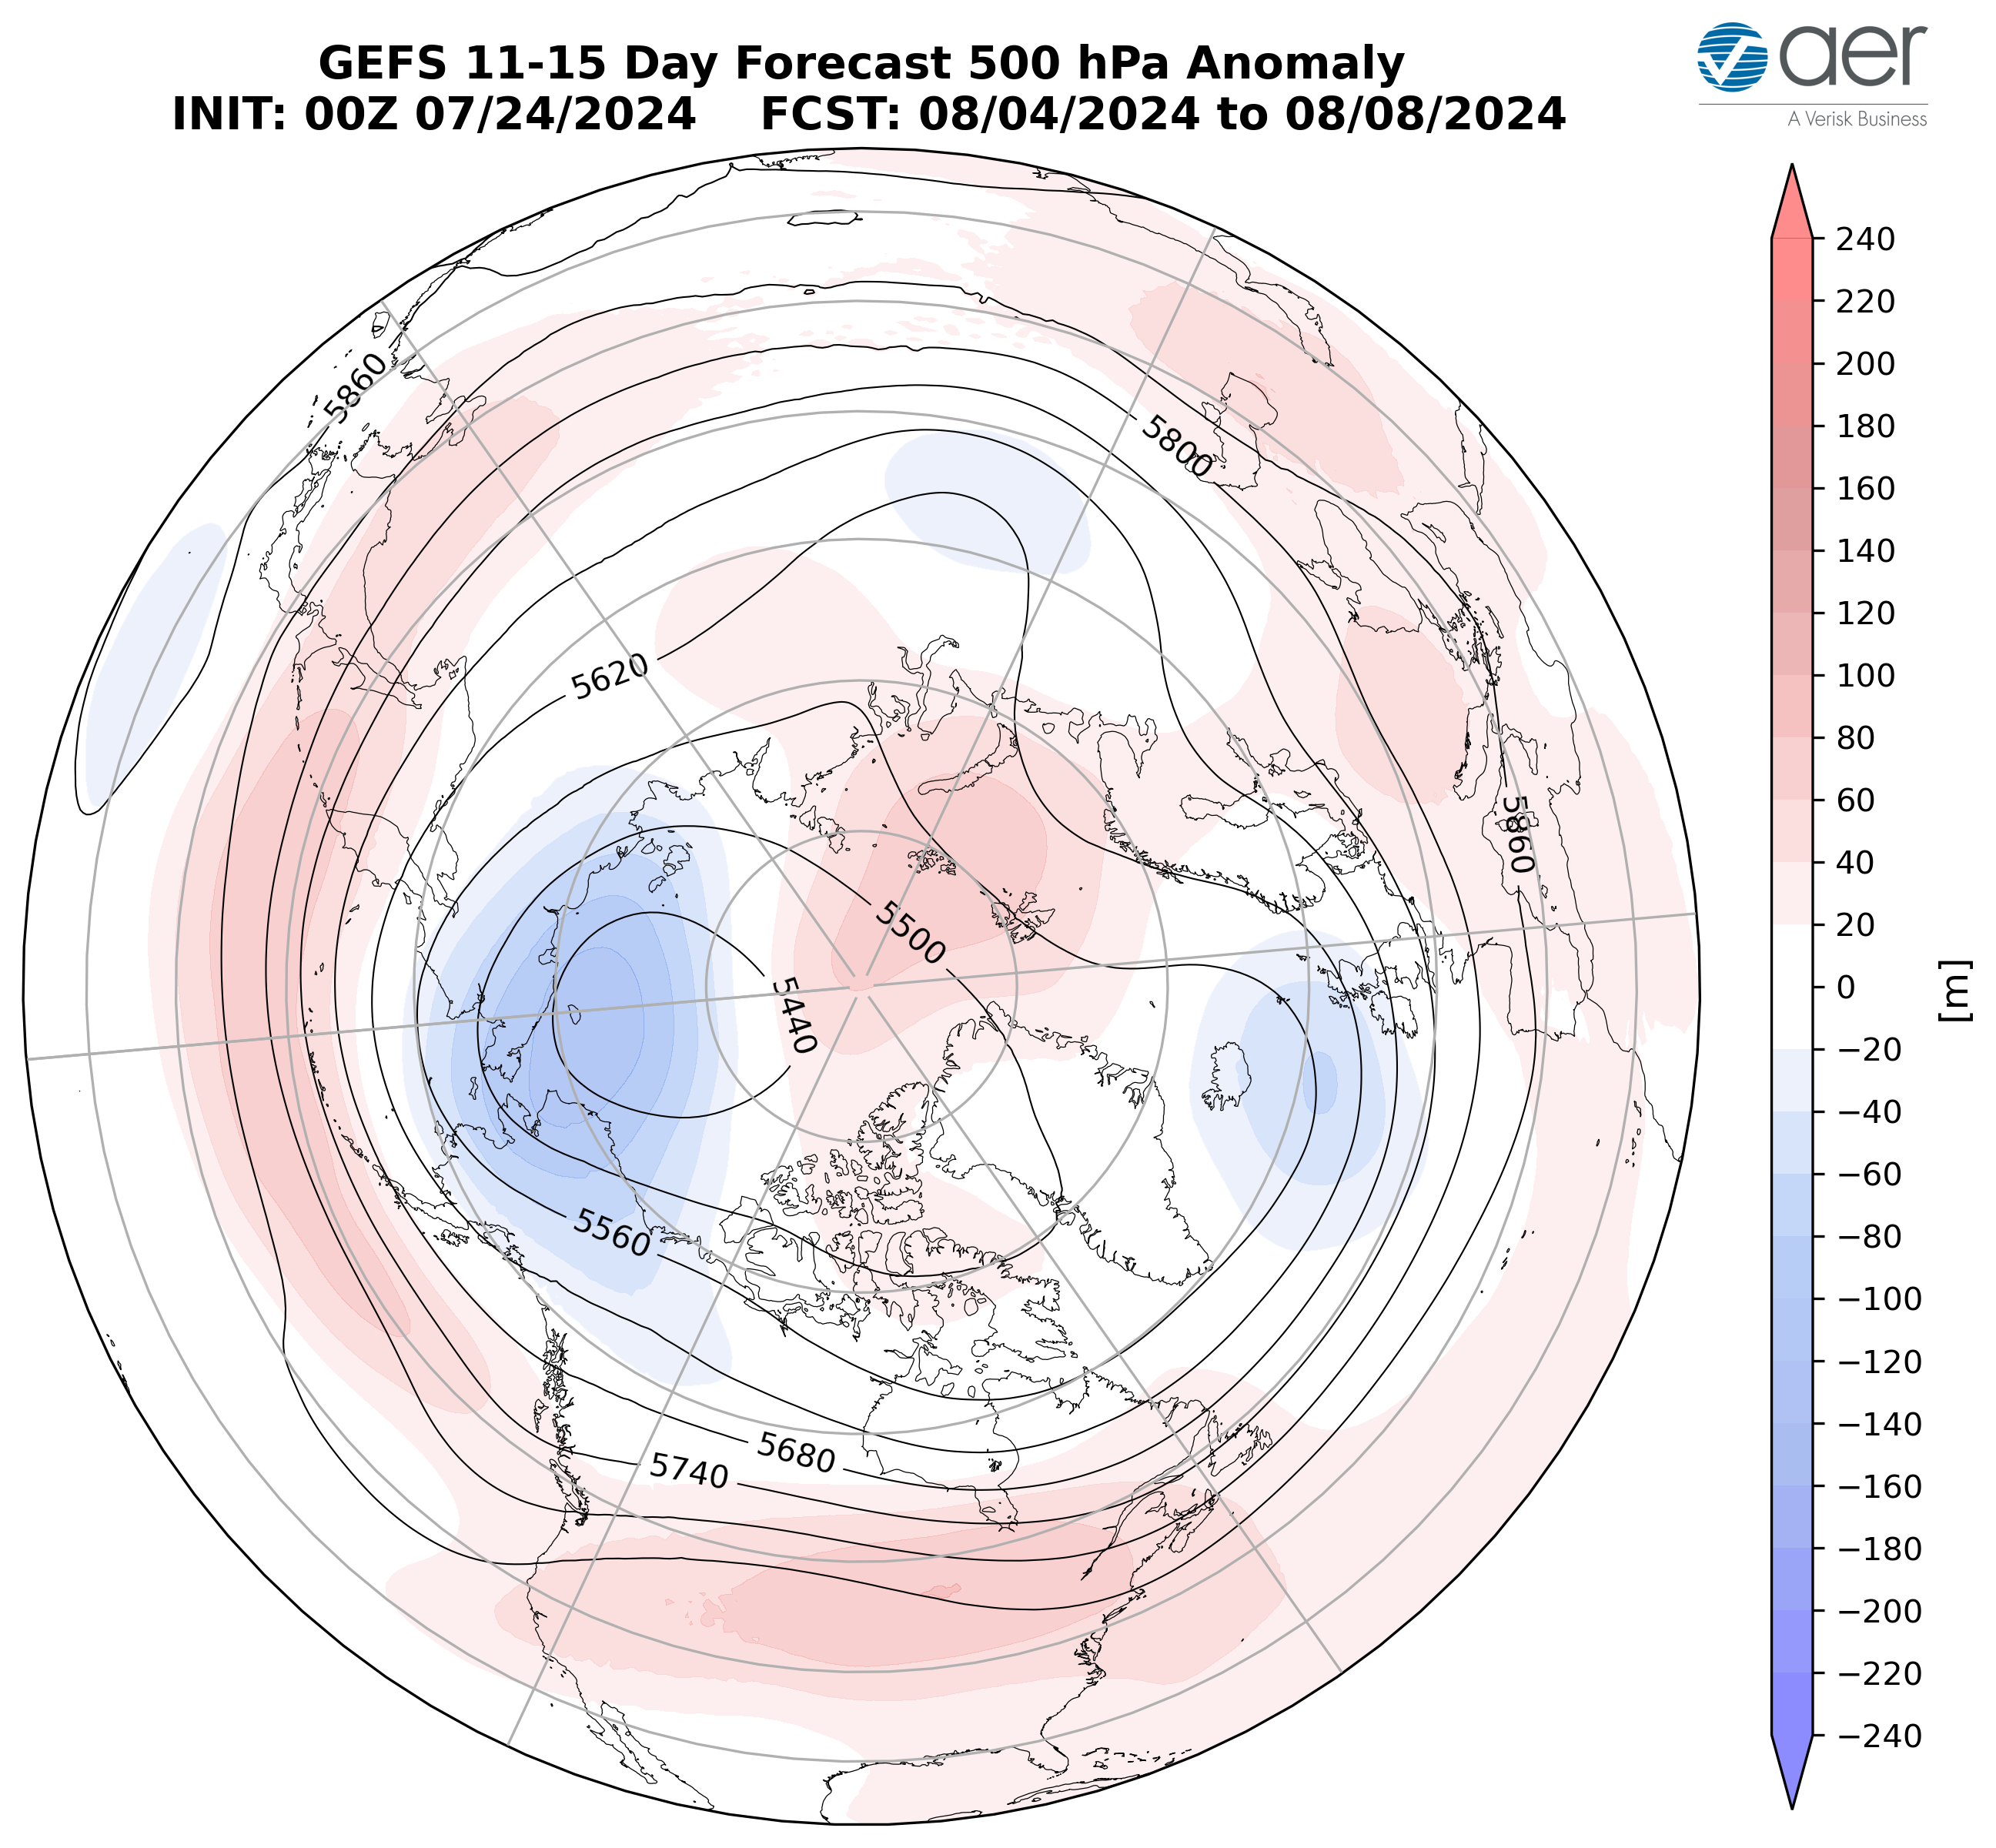
Figure 8. Forecasted average 500 mb geopotential heights (dam; contours) and geopotential height anomalies (m; shading) across the Northern Hemisphere from 4 – 8 August 2024. The forecasts are from the 00z 24 July 2024 2024 GFS ensemble.
Persistent troughing/negative geopotential height anomalies across Greenland will once again extend into Northwestern Europe and continue to support ridging/positive geopotential height anomalies across much of Europe this period (Figure 8). This pattern should favor widespread normal to above normal temperatures across much of Europe with closer to seasonable temperatures across Northwestern Europe including the UK this period (Figures 9). The pattern of ridging/positive geopotential height anomalies centered in the Barents-Kara Seas forcing troughing/negative geopotential height anomalies to the south across Western Asia and to the east across Northeastern Siberia with more ridging/positive geopotential height anomalies centered across Central Asia is predicted to continue yet again this period (Figure 8). The predicted pattern favors widespread normal to above normal temperatures across much of Asia with normal to below normal temperatures mostly confined to Eastern Siberia this period (Figure 9).
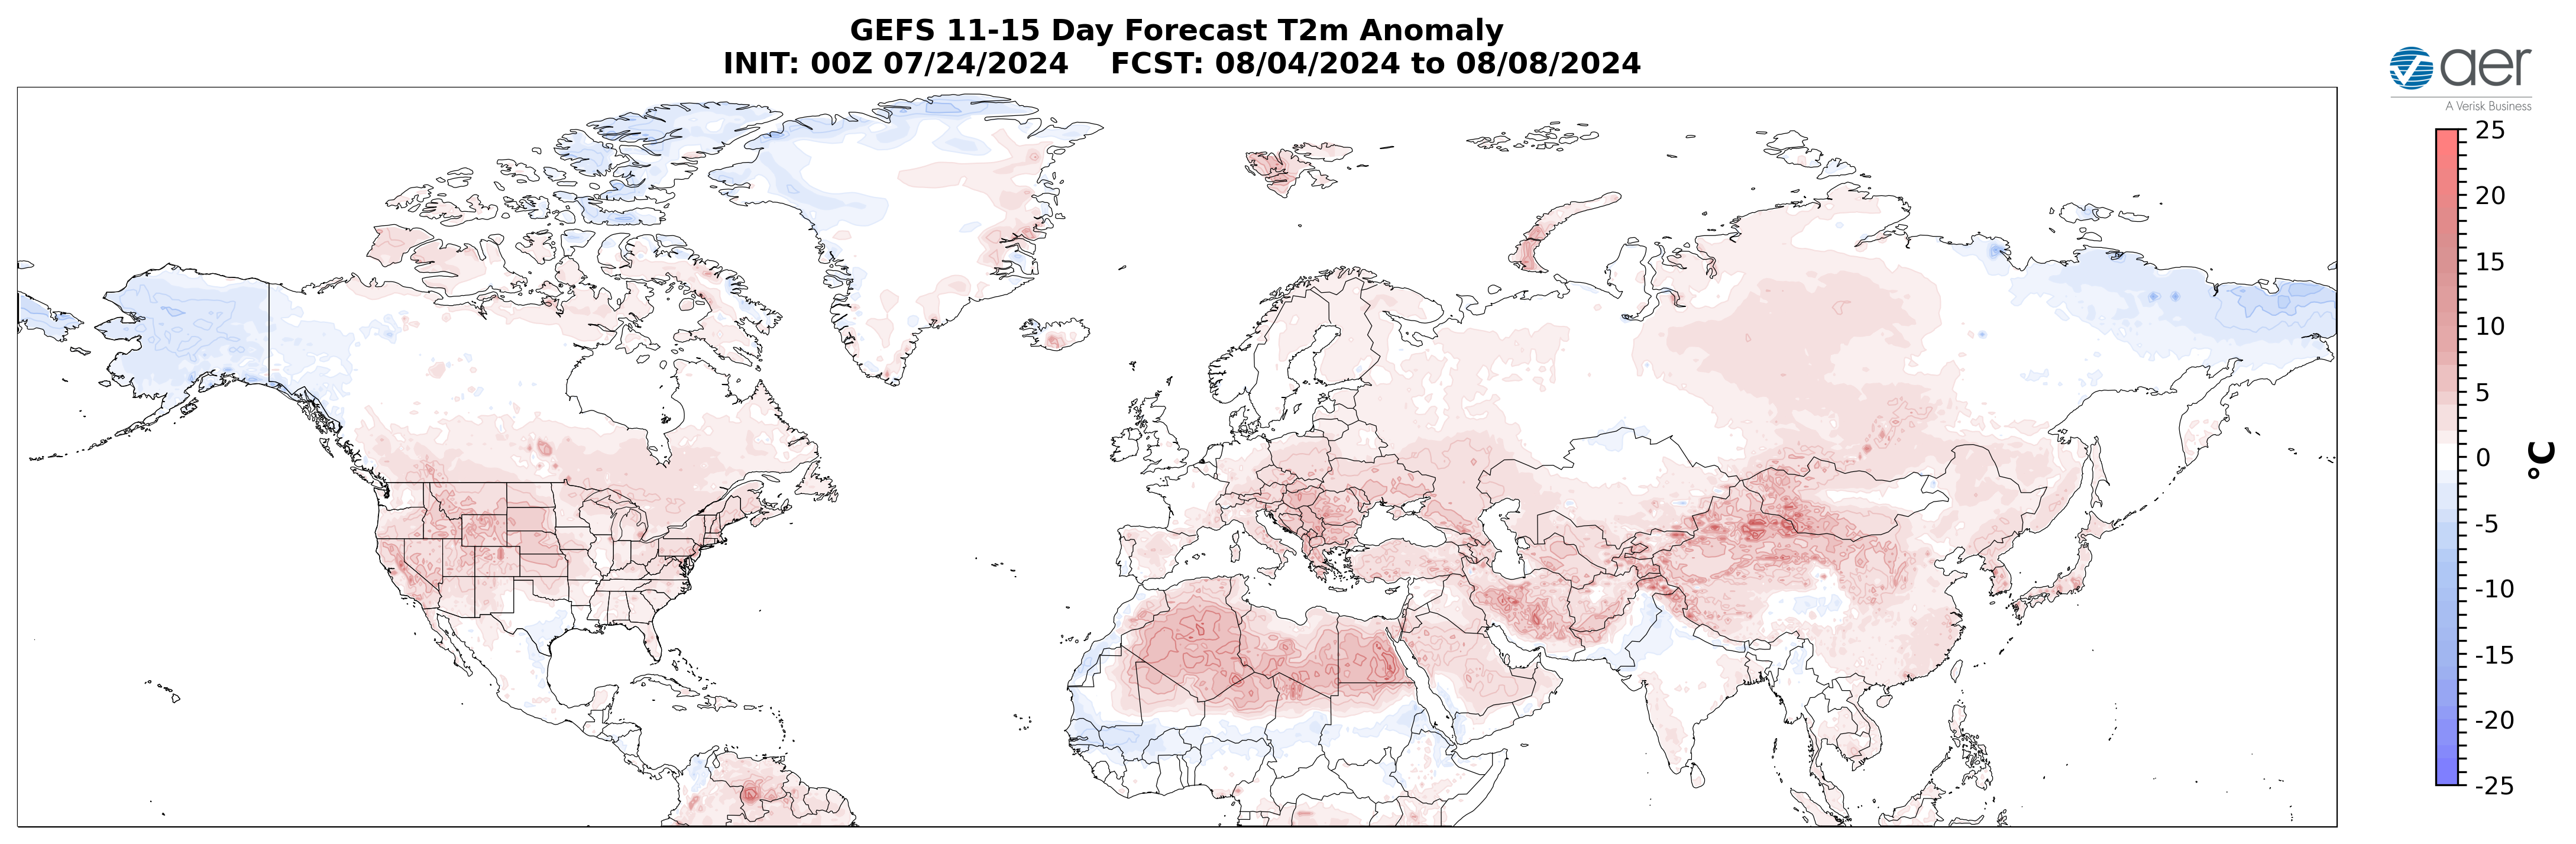
Figure 9. Forecasted surface temperature anomalies (°C; shading) from 4 – 8 August 2024. The forecasts are from the 00z 24 July 2024 2024 GFS ensemble.
Troughing/negative geopotential height anomalies are predicted to remain entrenched across Alaska, Northwestern Canada and the Gulf of Alaska this period supporting ridging/positive geopotential height anomalies across much of Canada and much of the US (Figure 8). This pattern favors widespread normal to above normal temperatures across most of Canada and the US with normal to below normal temperatures limited to Alaska and Northwestern Canada this period (Figure 9).

Figure 10. Forecasted precipitation anomalies (mm/day; shading) from 4 – 8 August 2024. The forecast is from the 00Z 24 July 2024 2024 GFS ensemble.
Troughing will support above normal rainfall across Southern Siberia, the Tibetan Plateau and across parts of East Asia with normal to below normal rainfall elsewhere across Eurasia this period (Figure 10). Troughing will support above normal rainfall for Alaska, Northwestern Canada and the Southeastern US with normal to below normal rainfall across the remainder of North America this period (Figure 10).
Longer Term
30–day
The latest plot of the polar cap geopotential height anomalies (PCHs) currently shows warm/positive PCHs through much of the stratosphere and troposphere with the exception of cold/negative PCHs in the upper stratosphere and lower troposphere (Figure 11). Then for the next two weeks warm/positive PCHs will persist throughout most of the stratosphere and troposphere but weaken somewhat with the exception of cold/negative PCHs in the upper stratosphere and the lower troposphere (Figure 11).
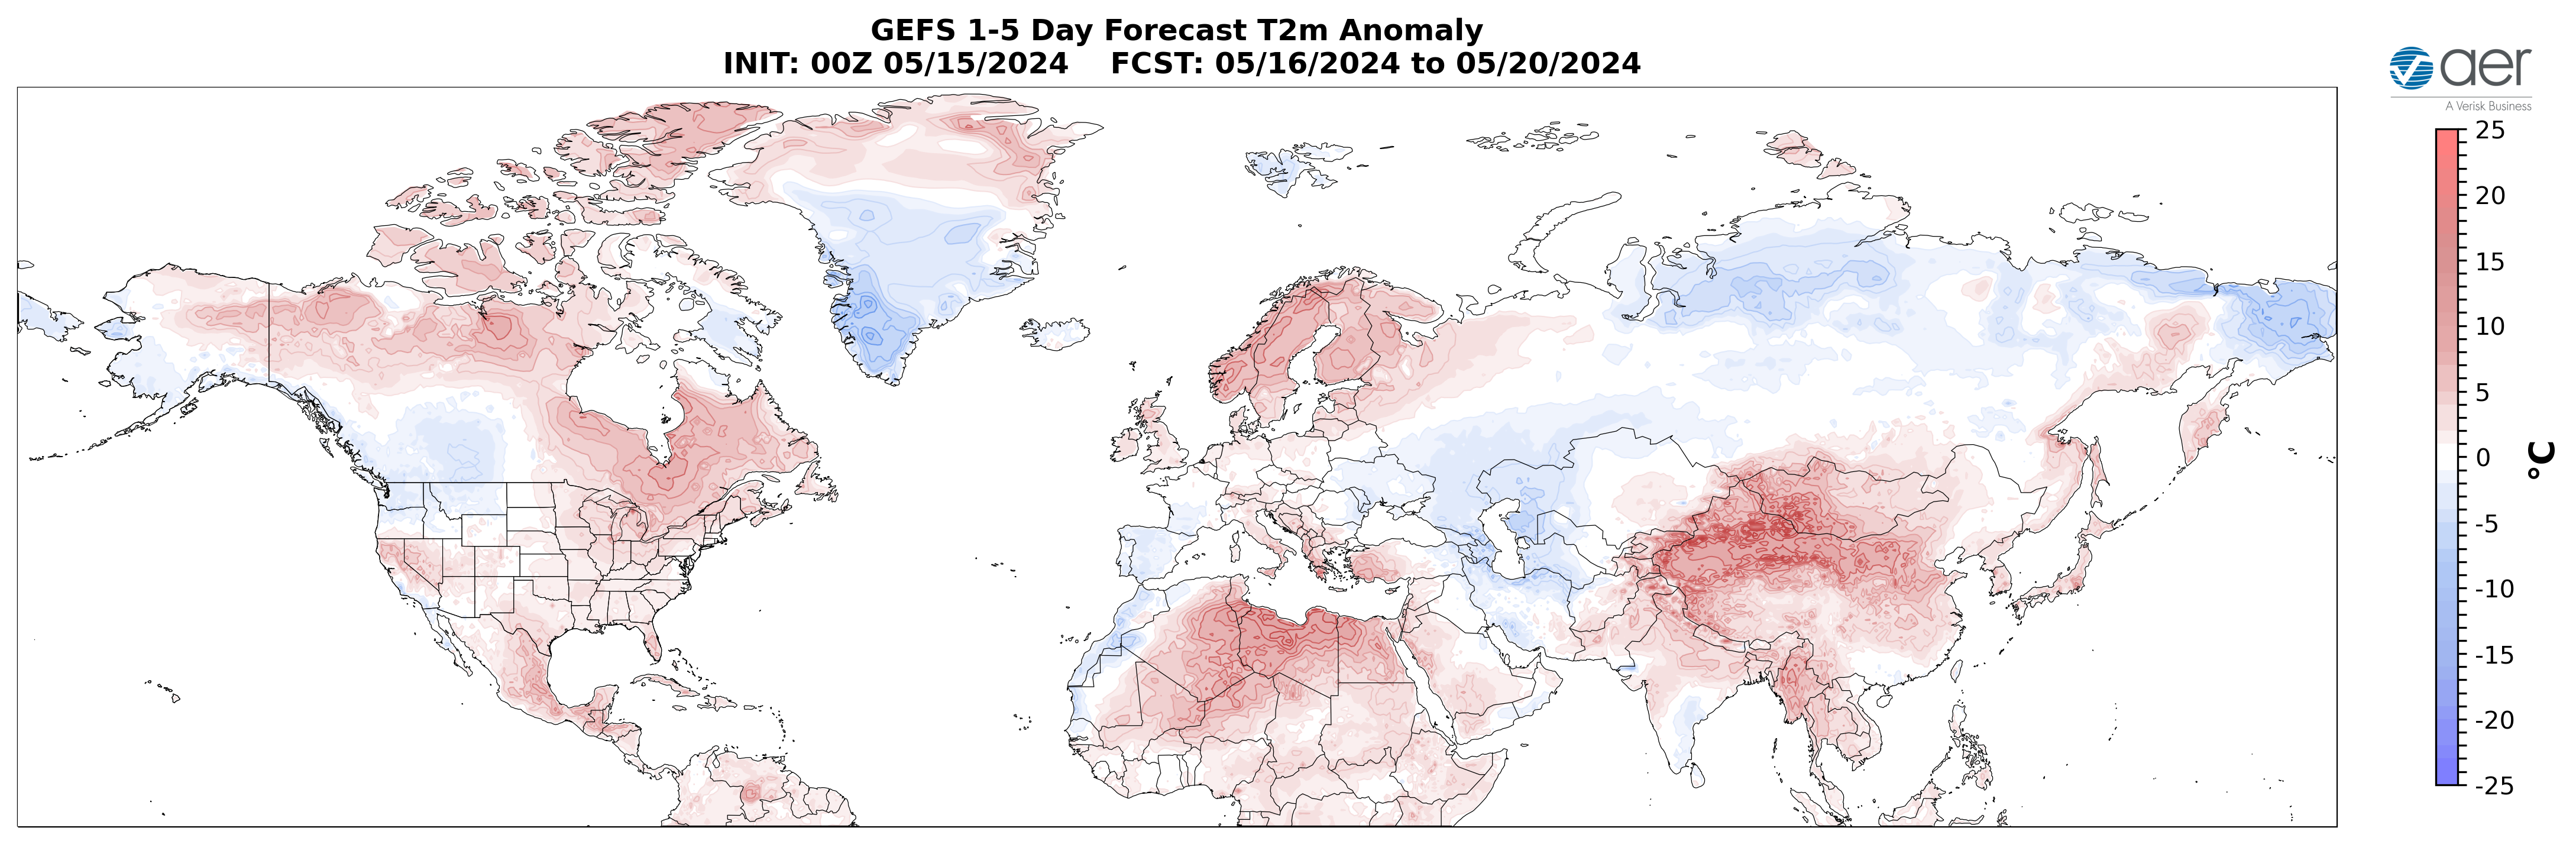 Figure 11. Observed and predicted daily polar cap height (i.e., area-averaged geopotential heights poleward of 60°N) standardized anomalies. The forecast is from the 00Z 24 July 2024 2024 GFS ensemble.
The predicted cold/negative PCHs near the surface the next two weeks (Figure 11) are consistent with the predicted positive surface AO the next two weeks (Figure 1). However, there is always the possibility that the warm/positive PCHs in the mid to upper troposphere will descend to the surface forcing a period of a negative AO. Something to watch for the remainder of the summer.
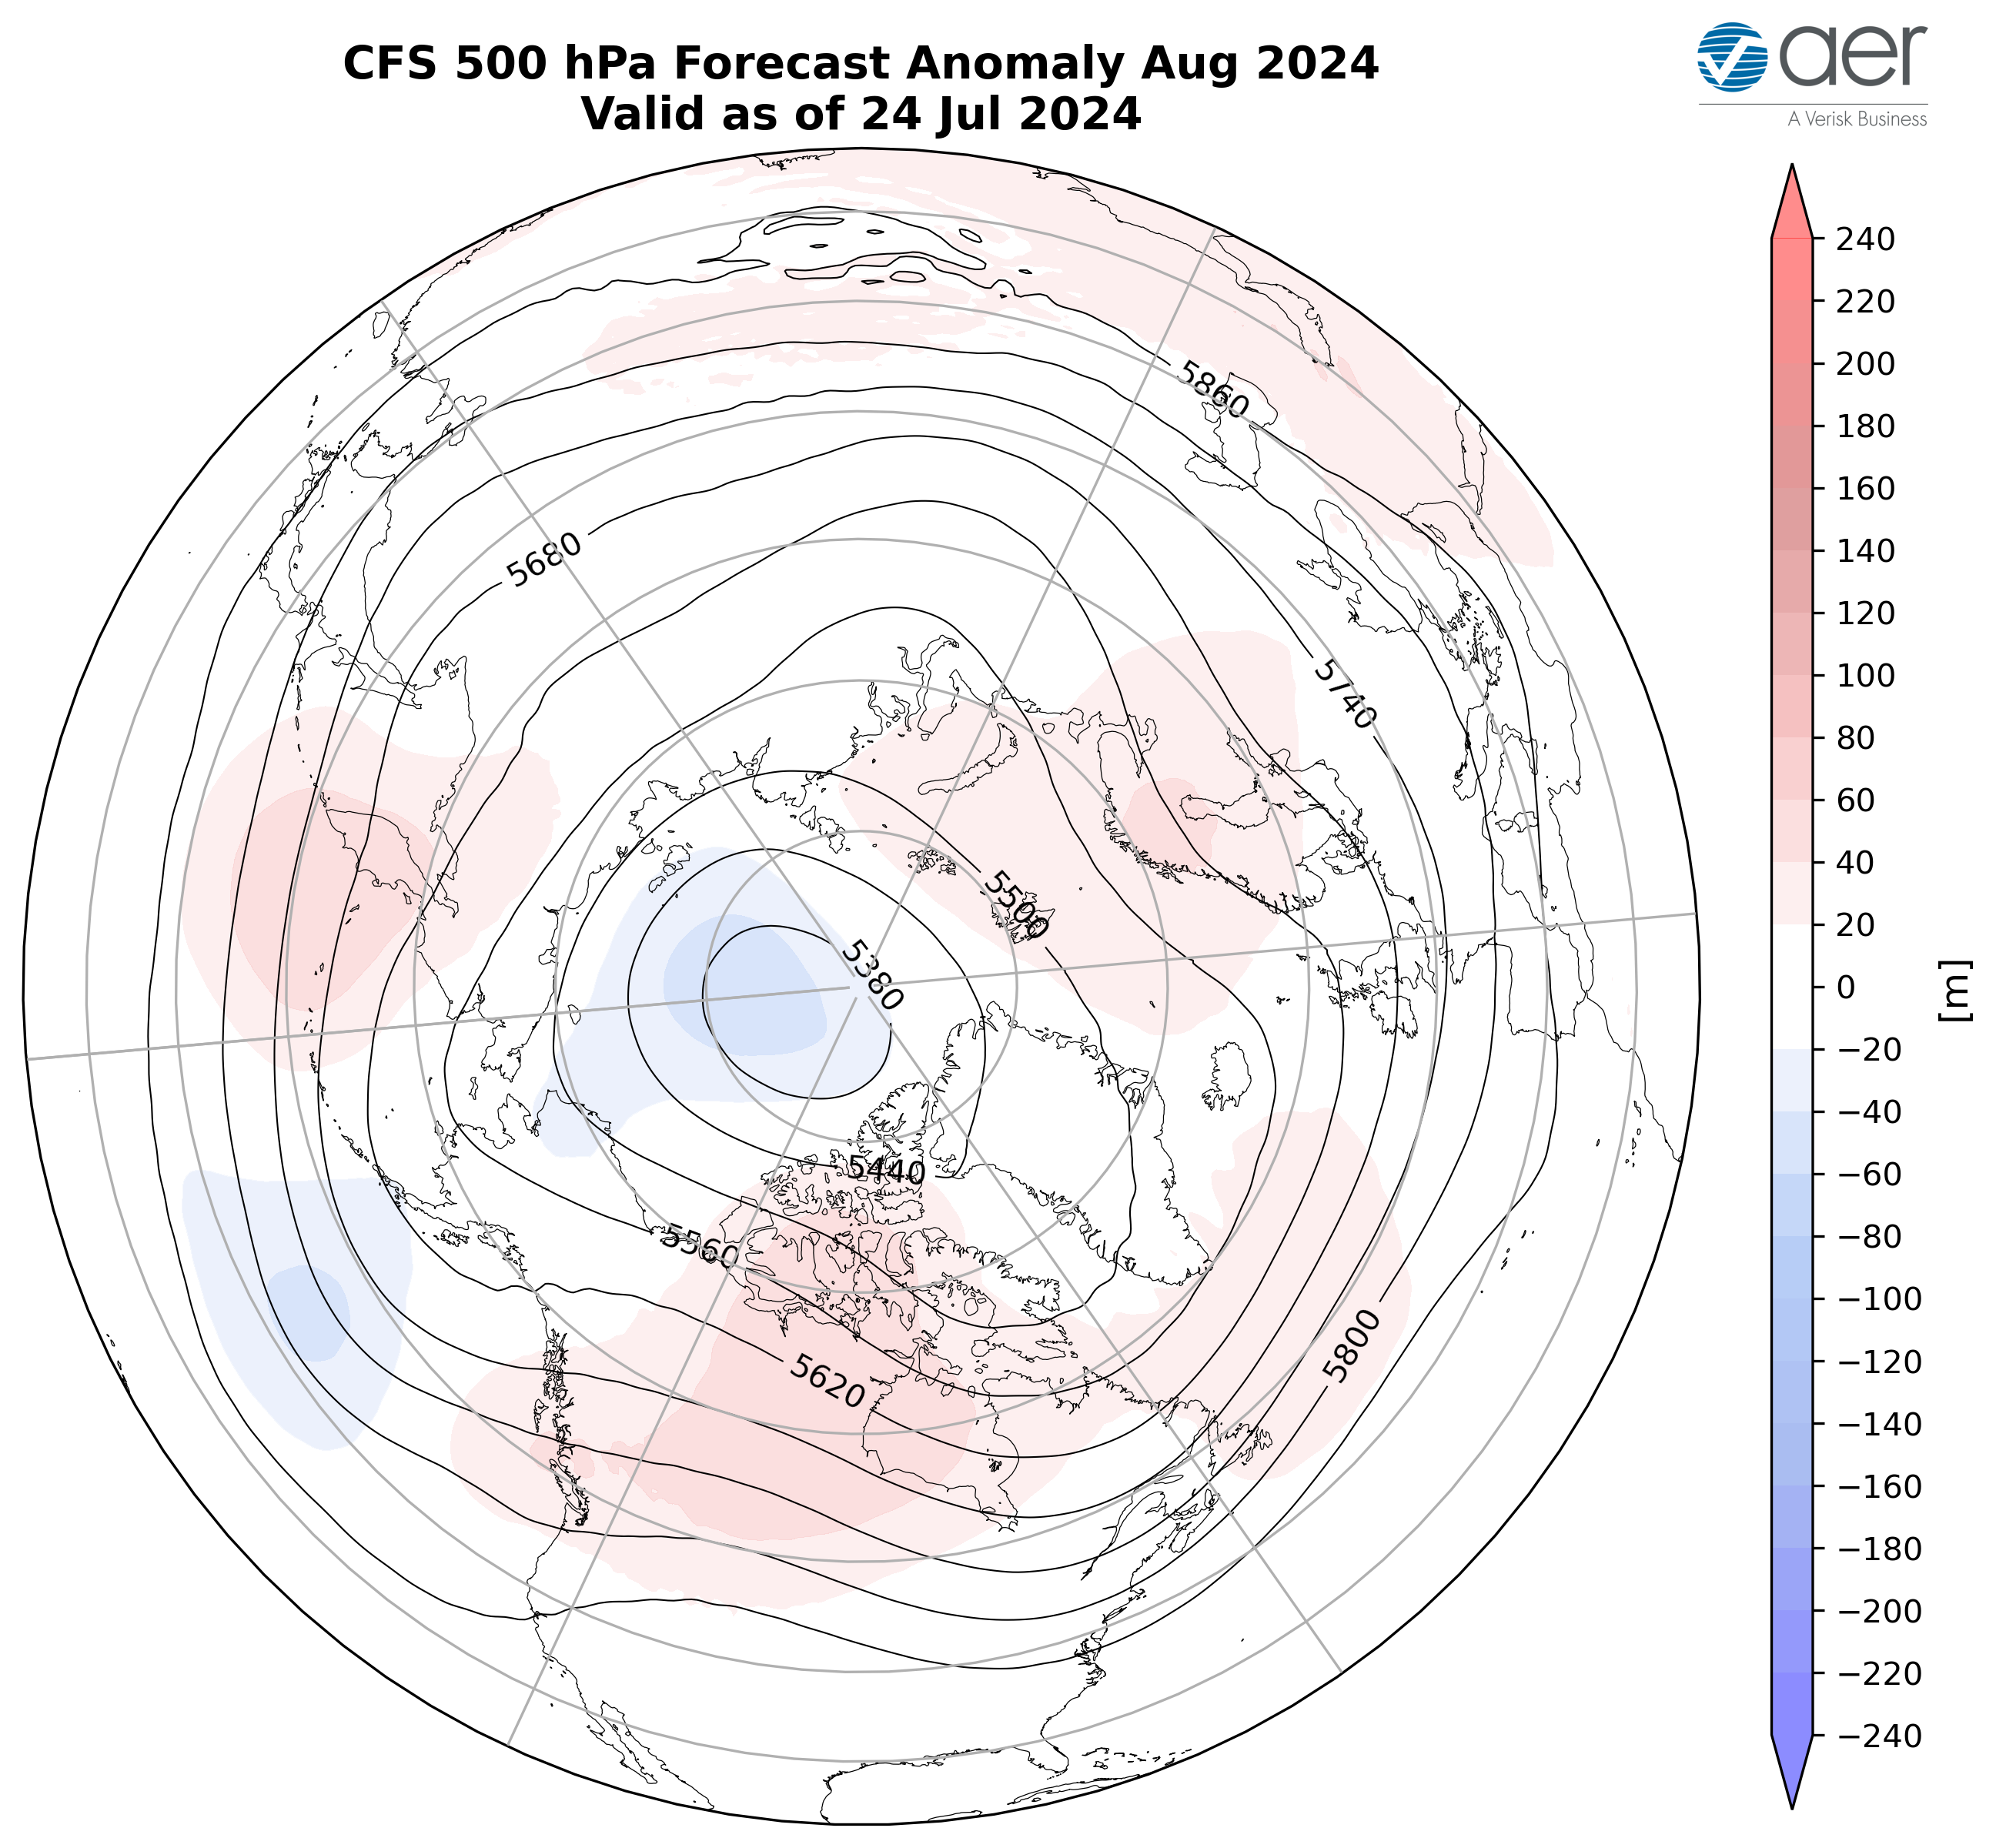
Figure 12. Forecasted average 500 mb geopotential heights (dam; contours) and geopotential height anomalies (m; shading) across the Northern Hemisphere for August 2024. The forecasts are from the 00Z 24 July 2024 2024 CFS.
I include in this week’s blog the monthly 500 hPa geopotential heights (Figure 12) and surface temperatures for August (Figure 13) from the Climate Forecast System (CFS; the plots represent yesterday’s four ensemble members). The forecast for the troposphere is ridging centered on the North Pole, Western Europe, Central Asia, Central Canada and the Central US with troughing across Scandinavia, Eastern Siberia, Alaska, Western Canada, and the Eastern US (Figure 12). This pattern favors seasonable to relatively warm temperatures across Southern Europe, Western and Central Asia, Central and Eastern Canada and the Western US with seasonable to relatively cool temperatures for Northern Europe, Eastern Siberia, East Asia, Western Canada and the Eastern US (Figure 13).
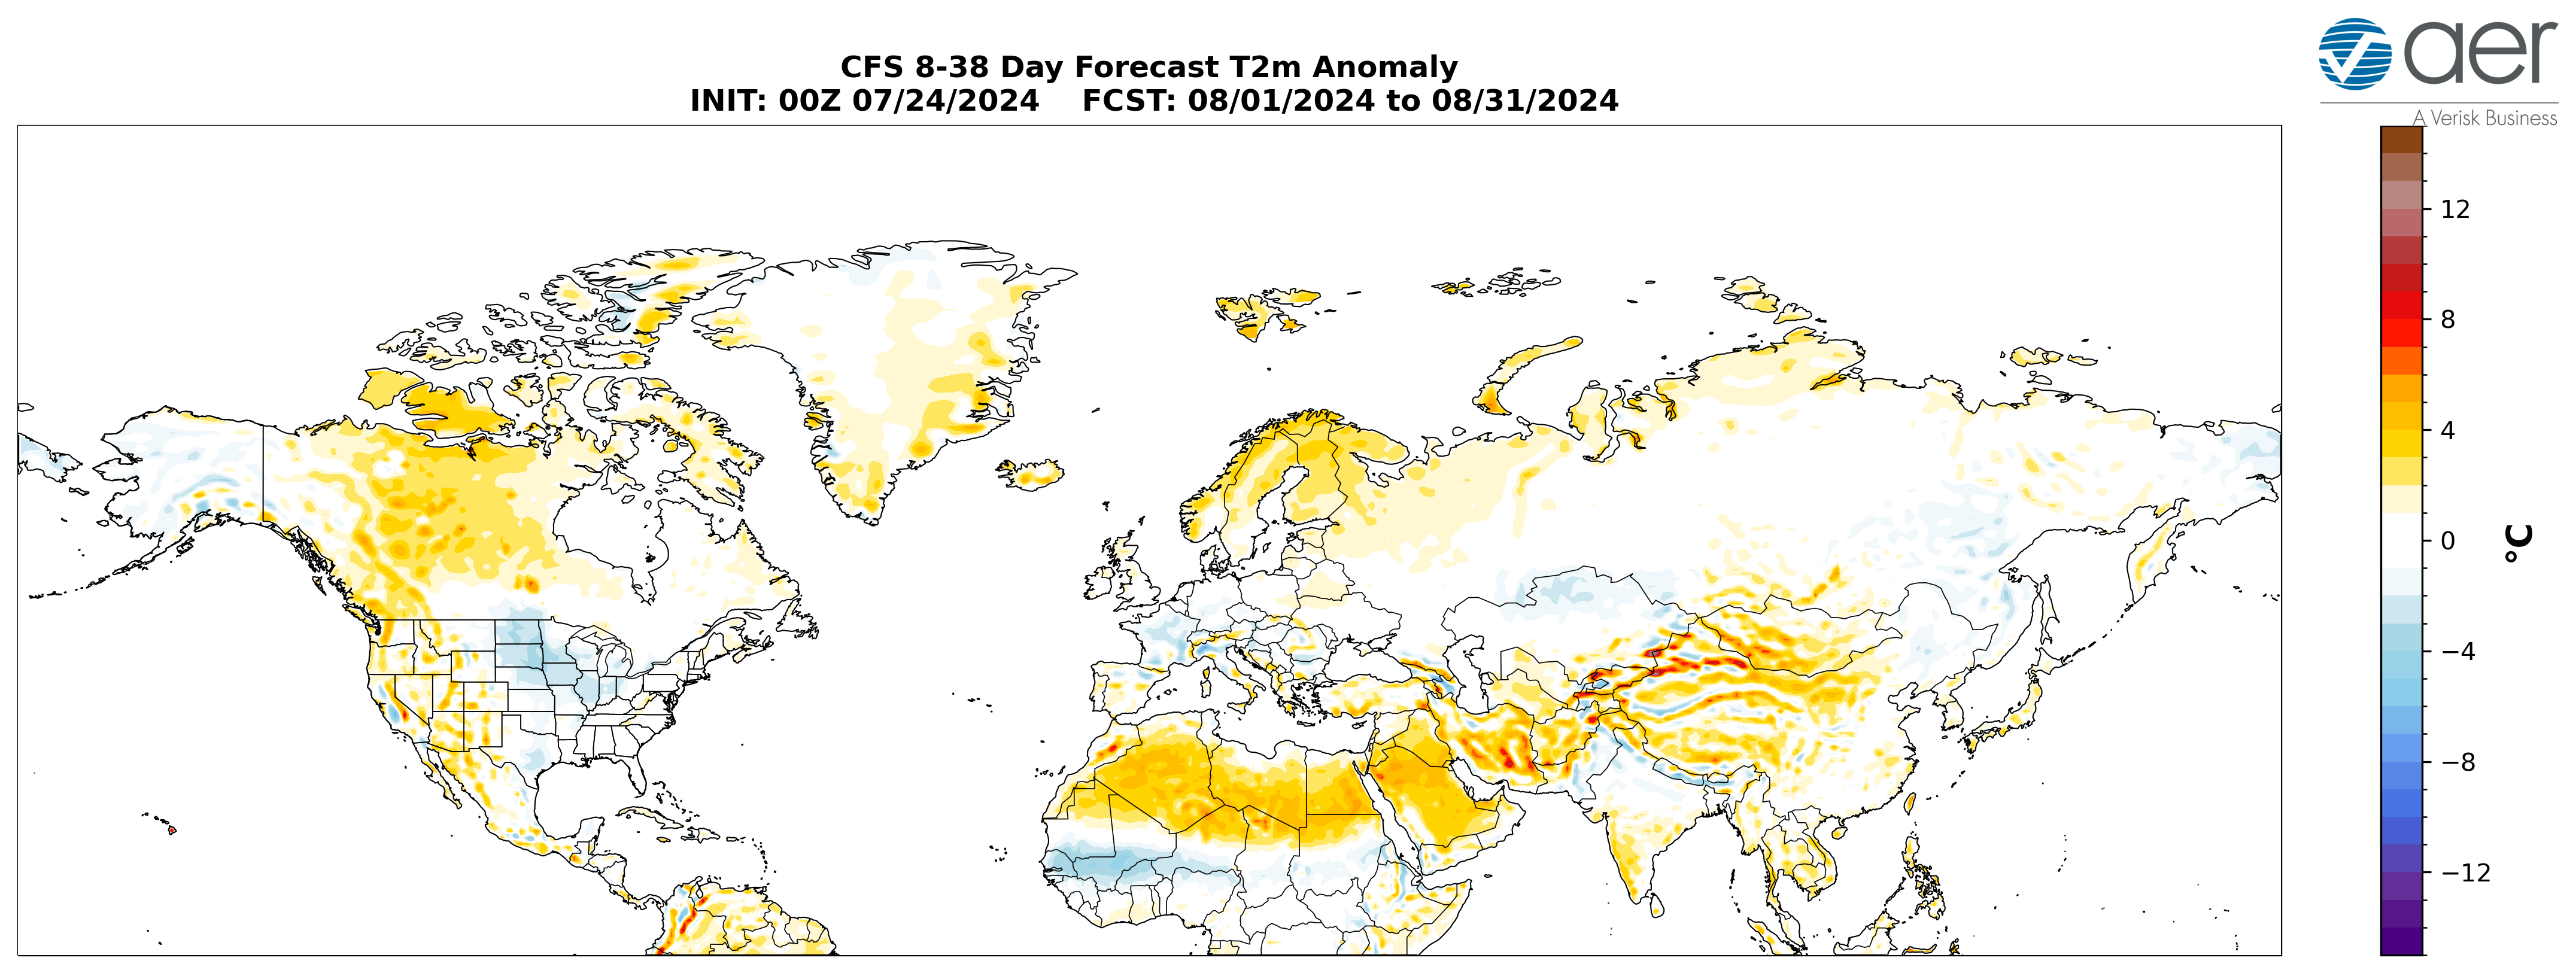
Figure 13. Forecasted average surface temperature anomalies (°C; shading) across the Northern Hemisphere for August 2024. The forecasts are from the 00Z 24 July 2024 CFS.
SSTs/El Niño/Southern Oscillation
Equatorial Pacific sea surface temperatures (SSTs) anomalies are below normal, especially along the Equator near South America, indicating emerging La Niña conditions (Figure 14) and neutral to La Niña conditions are expected through the summer. Observed SSTs across the NH remain well above normal especially in the central North Pacific (west of recent years), the western North Pacific, the eastern North Atlantic and offshore of eastern North America though below normal SSTs exist regionally especially in the South and North Pacific and the North Atlantic.
Figure 14. The latest daily-mean global SST anomalies (ending 22 July 2024). Plot taken from https://psl.noaa.gov/map/clim/sst.shtml
Madden Julian Oscillation
Currently the Madden Julian Oscillation (MJO) is weak where no phase is favored (Figure 15). The forecasts are for the MJO to remain weak for the next two weeks. Therefore the MJO seems to be having little influence on the weather across North America weather next week. But admittedly this is outside of my expertise.
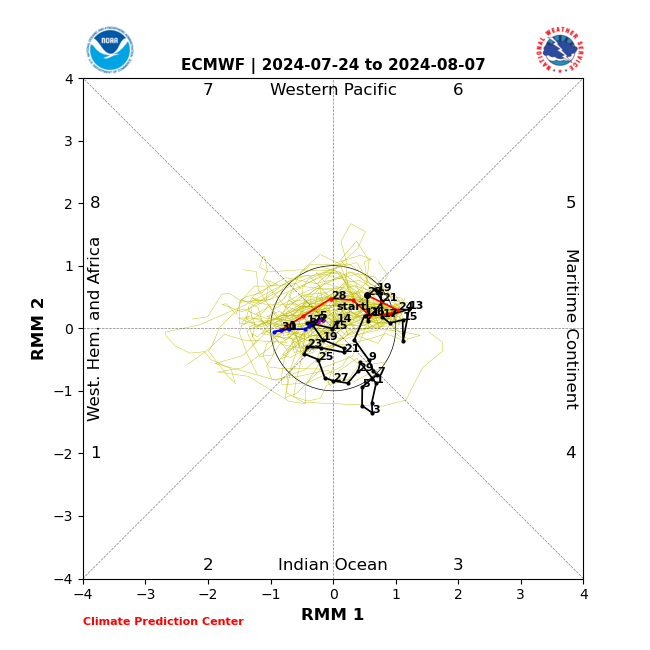
Figure 15. Past and forecast values of the MJO index. Forecast values from the 00Z 24 July 2024 ECMWF model. Yellow lines indicate individual ensemble-member forecasts, with the green line showing the ensemble-mean. A measure of the model “spread” is denoted by the gray shading. Sector numbers indicate the phase of the MJO, with geographical labels indicating where anomalous convection occurs during that phase. Image source: https://www.cpc.ncep.noaa.gov/products/precip/CWlink/MJO/CLIVAR/clivar_wh.shtml
Get Detailed Seasonal Weather Intelligence with sCast
We appreciate your taking the time to read the public Arctic Oscillation blog from Dr. Judah Cohen and the AER Seasonal Forecasting team.
Dr. Cohen’s detailed monthly seasonal forecast, sCast, is also available for purchase. sCast provides a monthly 30-60-90-180-day outlook into temperature and precipitation, solar flux and wind anomalies across the globe, and regional population weighted cooling and heating degree forecasts for the US.
Our sCast principal engineer, Karl Pfeiffer, can help you use sCast and other AER seasonal forecast products to deliver important, long-lead time weather intelligence to your business. Please reach out to Karl today!


 (click image to play)
