November 11, 2024
Dr. Judah Cohen from Atmospheric and Environmental Research (AER) embarked on
an experimental process of regular research, review, and analysis of the Arctic
Oscillation (AO) nd Polar Vortex (PV). This analysis is intended to provide researchers
and practitioners real-time insights on one of North America’s and Europe’s leading
drivers for extreme and persistent temperature patterns.
During the winter schedule the blog is updated once every week. Snow accumulation
forecasts replace precipitation forecasts. Also, there is renewed emphasis on ice and
snow boundary conditions and their influence on hemispheric weather. In late Spring,
we transition to a spring/summer schedule, which is once every two weeks. Snow
accumulation forecasts will be replaced by precipitation forecasts. Also, there will be
less emphasis on ice and snow boundary conditions and their influence on hemispheric weather.
Subscribe to our email list or follow me on Twitter (@judah47) for notification of updates.
The AO/PV blog is partially supported by NSF grant AGS: 1657748
Summary
- The Arctic Oscillation (AO) is currently neutral and is predicted to neutral through next week as pressure/geopotential height anomalies across the Arctic are currently mixed and are predicted to remain mixed over the next two weeks. The North Atlantic Oscillation (NAO) is currently positive with mostly negative pressure/geopotential height anomalies across Greenland and the NAO is predicted to trend negative into negative territory next week as pressure/geopotential height anomalies are predicted to become positive across Greenland.
- This week ridging/positive geopotential height anomalies just west of the British Isles will support troughing/negative geopotential height anomalies mostly in Western Europe. Then next week as Greenland blocking strengthens, European troughing will deepen. This pattern will support mostly normal to below normal temperatures across Western Europe including the United Kingdom (UK) with normal to above normal temperatures elsewhere but then next week normal to below normal temperatures will spread across much of Europe except for Southeastern Europe.
- The general pattern predicted for Asia the next two weeks is ridging/positive geopotential height anomalies centered first in the Central Arctic and then over Greenland forcing troughing/negative geopotential height anomalies across Northern and Central Asia this week but then just limited to Northern Asia next week with more ridging/positive geopotential height anomalies across Southern and Eastern Asia. This pattern favors widespread normal to above normal temperatures across much of Asia with normal to below normal temperatures limited to Kazakhstan and parts of Siberia this week, however next week the colder temperatures are predicted to be limited to Northern Siberia.
- This week and into next week ridging/positive geopotential height anomalies centered south of the Aleutians will support troughing/negative geopotential height anomalies across Alaska, Western Canada and the Western United States (US) with more ridging/positive geopotential height anomalies across eastern North America. Then the fourth week of November, some weak troughing will slide east across the US. This pattern favors normal to above normal temperatures across Eastern Canada and the Eastern US with normal to below normal temperatures across Alaska, Western Canda and the Western US. However, the fourth week of November temperatures will become more seasonal in the Eastern US.
- In the Impacts section I discuss some of the implications of a strengthening polar vortex stretch and Greenland blocking how they may impact the upcoming weather in the Northern Hemisphere (NH).
Plain Language Summary
The snow cover extent across Asia in October was slightly above average (see Figure i). I consider this a weak signal at best when using snow cover as a predictor for the upcoming winter. In the shorter term, the polar vortex is predicted to strengthen (see Figure 12a) and this will likely maintain warmer weather for the foreseeable future (see Figures 6 & 9). Some exceptions are Northwestern Europe, and even possibly the Eastern US due to a blocking high over Greenland. The European model has been suggesting a stretched polar vortex later this month that could finally bring the first real cold to the Eastern US but for now this remains speculative.
Impacts
The monthly mean snow cover extent (SCE) is in and it was slightly above normal, pretty close to the values of the past four years but just a little higher. Like sausages, you really don’t want to know how the monthly mean SCE is calculated, but there was a late surge at the very end that pushed it a bit higher from the 10’s to 11.3 million squared kilometers for the monthly average shown in Figure i. The long-term average is around 9 million squared kilometers but in recent decades it is closer to 10 million squared kilometers. As a reminder the more extensive snow cover across Eurasia in October, and this mostly confined to Siberia, the more likely the PV will be weaker than normal during the winter months that favors widespread colder temperatures across the Northern Hemisphere (NH) but in particular in East Asia and the US east of the Rockies. It also includes Northern Europe, but the relationship is weaker across Europe and in my own research rarely is it statistically significant. Other research emphasizes November as an important month as discussed last month, something that I consider as well.
As an aside it is very interesting how the variability on monthly Eurasian SCE has all but disappeared over the last five years. I have no idea why that is and whether it will continue but seems awfully strange. All in all, does seem to favor a weaker vortex this winter but like last winter, I don’t consider it a strong signal, which complicates the winter forecast, at least for me.
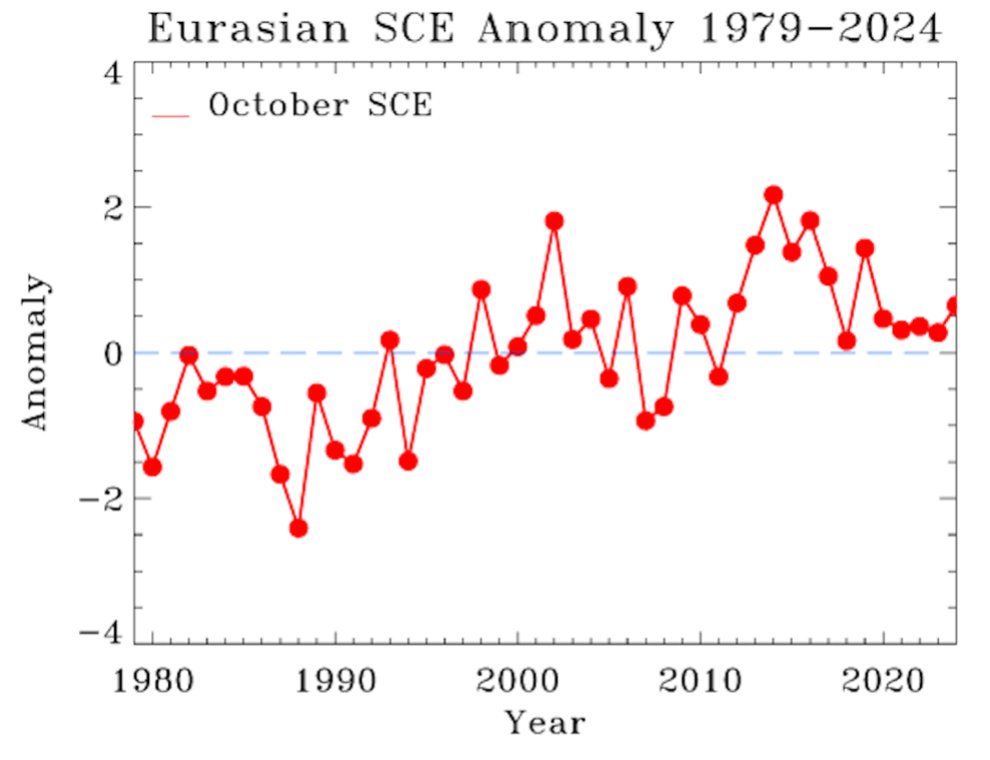
Figure i. Observed Monthly October Eurasian snow cover anomalies 1979-2024.
As I have also been discussing in the blog this month, another signal that I am watching closely and will over the next couple of months is Arctic sea ice extent (SIE) which continues to grow relatively slowly for now. And as I expected over the past several blogs, sea ice growth occurred preferentially in the North Pacific sector relative to the North Atlantic sector and the large negative anomaly in the North Atlantic sector compared to the North Pacific sector is now clearly dominant, with sea ice in the North Pacific close to normal (see Figure ii). This is important because it is the lack of sea ice in the Barents Kara Seas that favors a weak PV. The other region where sea ice is below normal is around Greenland. It appears to me that sea ice anomalies are evolving that are most favorable for supporting colder weather across Eurasia but possibly even the US. There is lots of noise and variability in the system, so a strong sea ice forcing doesn’t guarantee a weak PV and cold weather but if it is a mild winter don’t blame sea ice if the current trends continue.
November SCE extent could also be giving the low sea ice in the Barents-Kara Seas. As a dipole has formed with positive anomalies in East Asia but negative anomalies in Western Asia and Europe. With the onset of Greenland blocking snow cover should advance in Western Eurasia so still a fluid situation. So, in summary, which region will feature the largest negative anomalies in the coming months remains uncertain but it is looking increasingly likely that it will favor a weaker PV in the winter months.
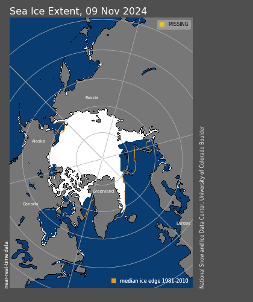
Figure ii. Observed Arctic sea ice extent on 9 November 2024 (white). Orange line shows climatological extent of sea ice based on the years 1981-2010. Image from the National Snow and Ice Data Center (NSIDC). URL: https://nsidc.org/sea-ice-today.
The models are predicting a strong stratospheric PV and that always has me on alert for an overall mild pattern across the Northern Hemisphere (NH). The GFS is predicting the strong PV to couple all the way to the surface with low tropospheric heights and likely a positive AO (see Figure 11). When this happens the potential for an extended mild pattern is elevated. The GFS is even predicting ridging centered over Siberia. If all the GFS forecasts verify, I am prepared not only to write off November but December as well. Strong PV coupled to a strong positive AO at the surface and ridging over Siberia is the trifecta of a long duration mild signal or a runaway locomotive that is hard to bring to a stop.
That is the lemons interpretation if you are eagerly awaiting the arrival of winter and here is the lemonade, the Canadian and especially the European models are suggesting possibly Ural ridging and not Siberian ridging. If that verifies weakening the PV is back in play. And if that ridging can couple with the low sea ice in the Barents-Kara Seas more meaningful weakening of the PV is possible starting sometime in December. In my opinion this an early but incredibly important juncture for the winter and like I said in a recent blog (I think last week) winter could be over before it even starts. There will be periods of winter weather, especially regionally of course, but an overall mild winter will be hard to overcome. But I don’t want to oversell the dire forecast as the latest models are coming around the European solution and even the European looks better today than yesterday.
In the short-term colder weather is coming to Europe and at least more seasonable weather to the Eastern US, thanks to Greenland blocking. As I discussed the past three weeks, warm/positive polar cap geopotential height anomalies (PCHs) that are shown to descend from the lower stratosphere to the lower troposphere now in mid-November at least over the North Atlantic sector (see Figure iii). The models seem to be consolidating around increasing high latitude blocking in the Central and/or North Atlantic sector of the Arctic including Greenland blocking. The models are slowly coming around to a more favorable pattern of a wintry weather in the Eastern US but especially northern Europe.
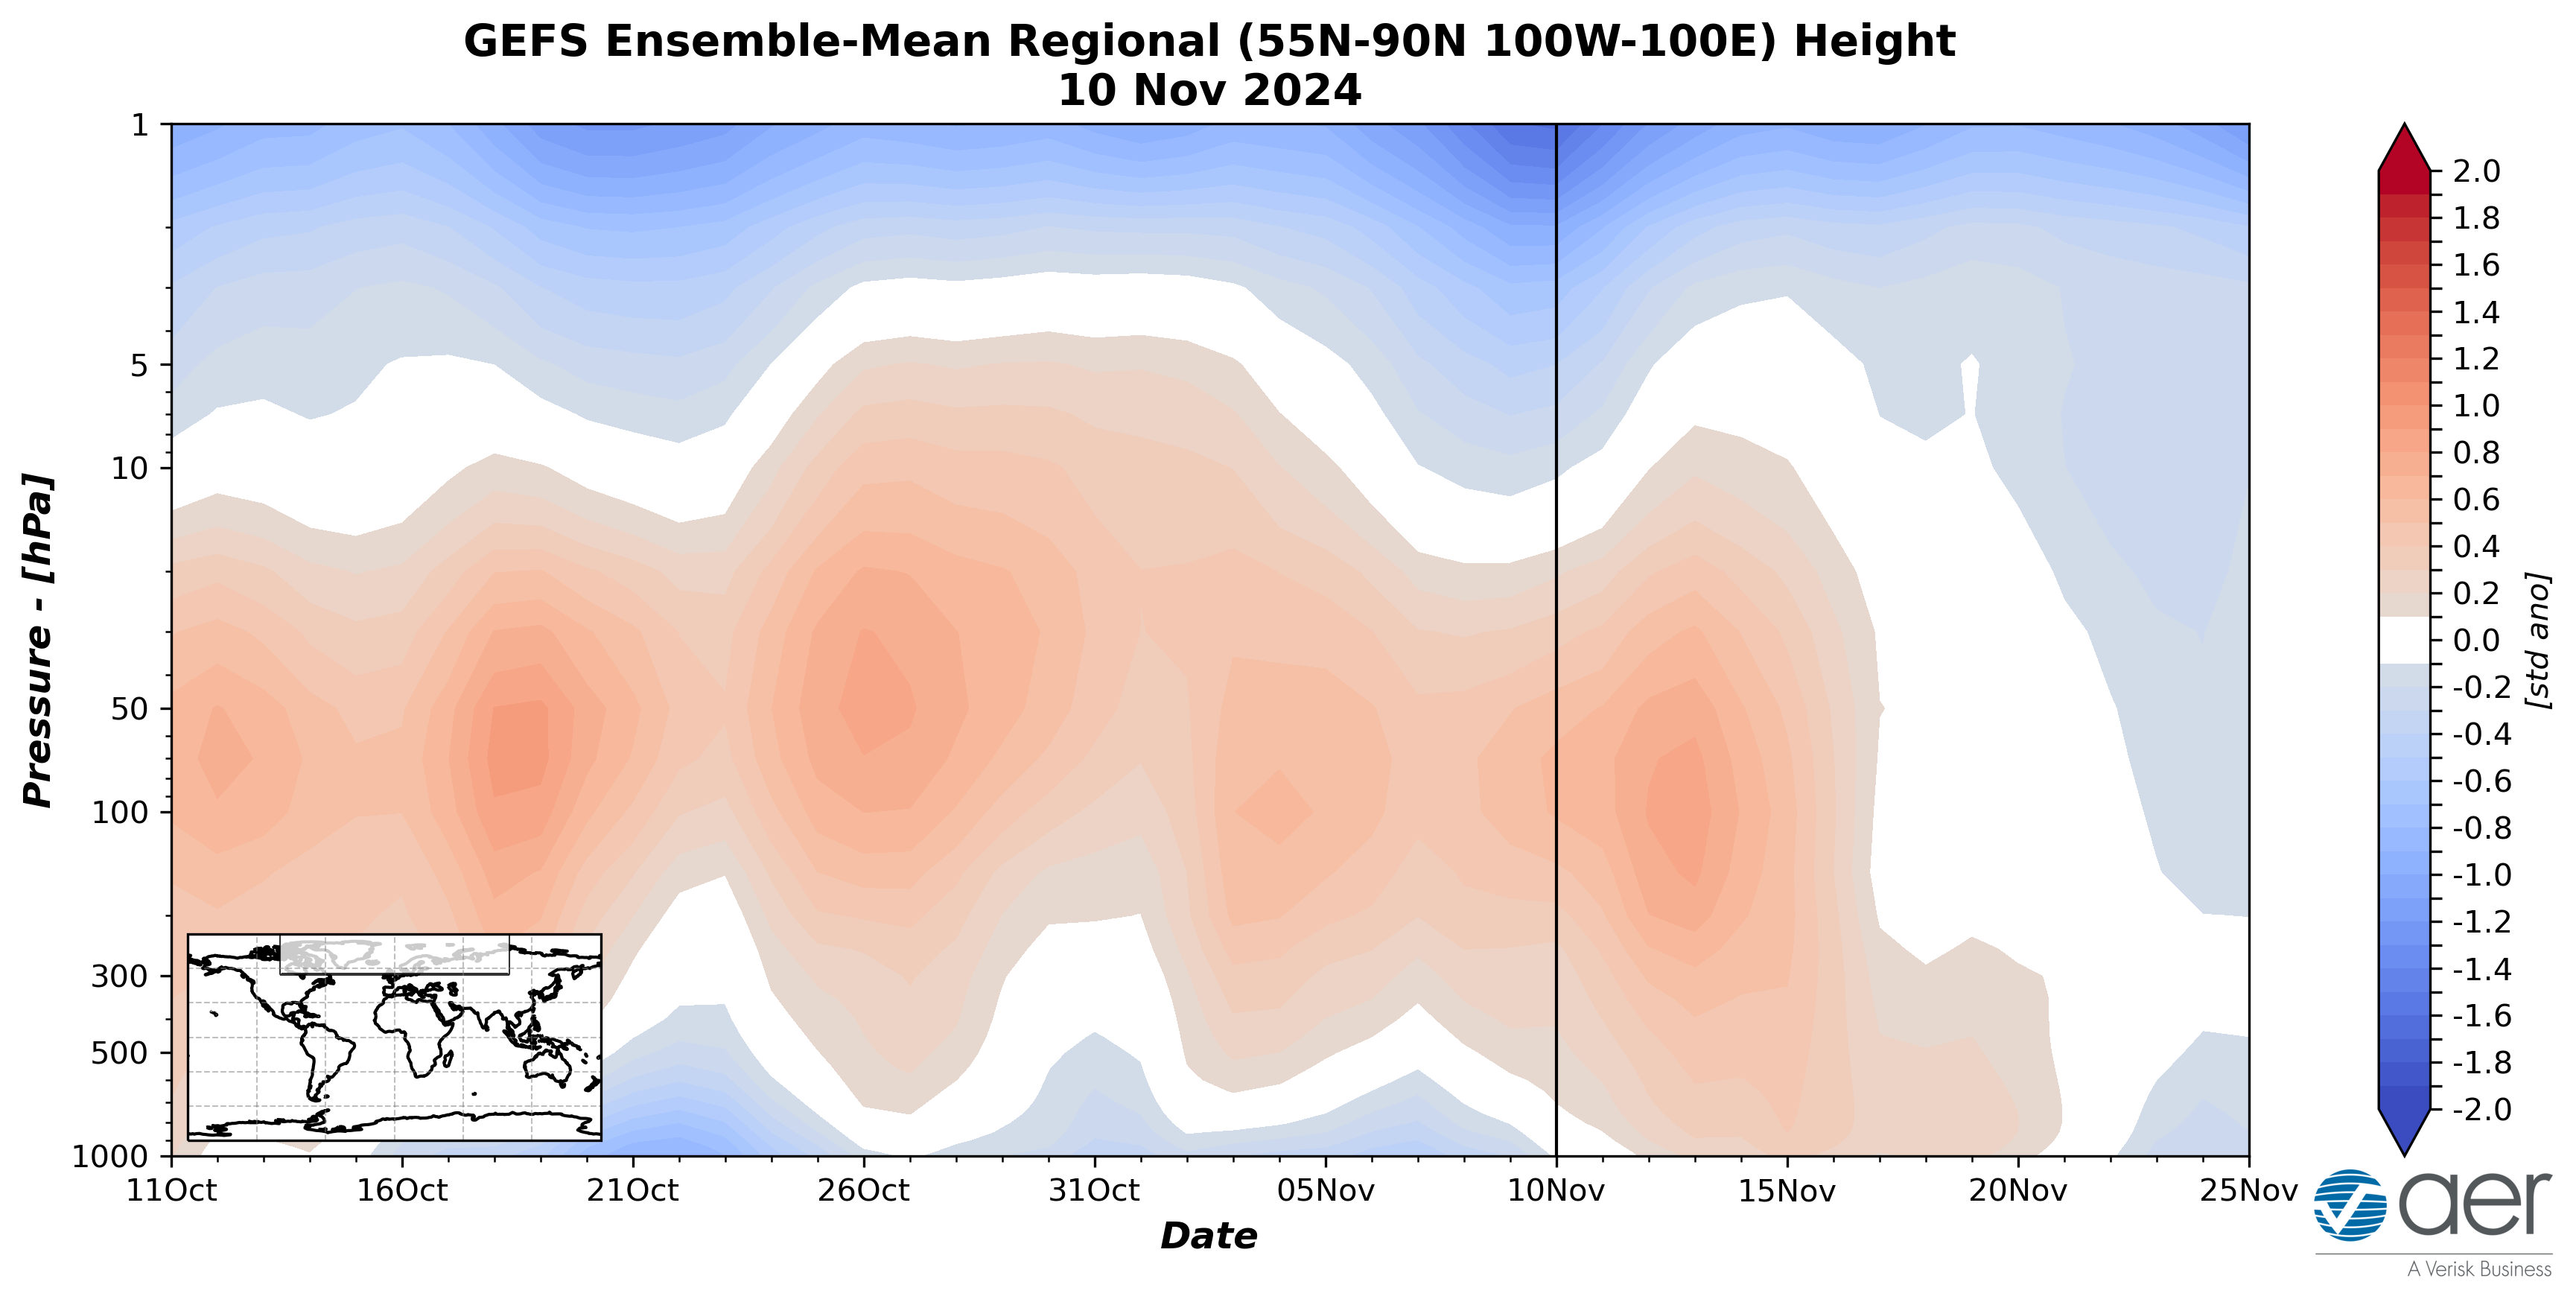
Figure iii. Observed and predicted daily polar cap height (i.e., area-averaged
geopotential heights poleward of 60°N) standardized anomalies limited to the North Atlantic sector (see insert). The forecast is from the 00Z 10 November 2024 GFS ensemble.
But the Greenland blocking looks to be transient and I am watching for greater influence from the predicted strengthening PV and an overall milder to possibly much milder pattern heading into December. Though again if the ECMWF is right the mild air could get short circuited.
However, looking at the PV forecasts it does seem to me that some models are evolving towards a stretched PV (see Figure iv) that would most likely favor colder weather in parts of Canada and the US. The ECMWF is most aggressive and the GFS the least. The stretched PV of the ECMWF is more consistent with the return of Ural blocking, the GFS the least with no real Ural blocking predicted. To Ural block, of not to Ural block, that is a very consequential question. This winter could be heading for a ditch it can’t get out of and in my opinion the best hope of getting winter back on track are Arctic boundary forcings, it should be interesting to follow.
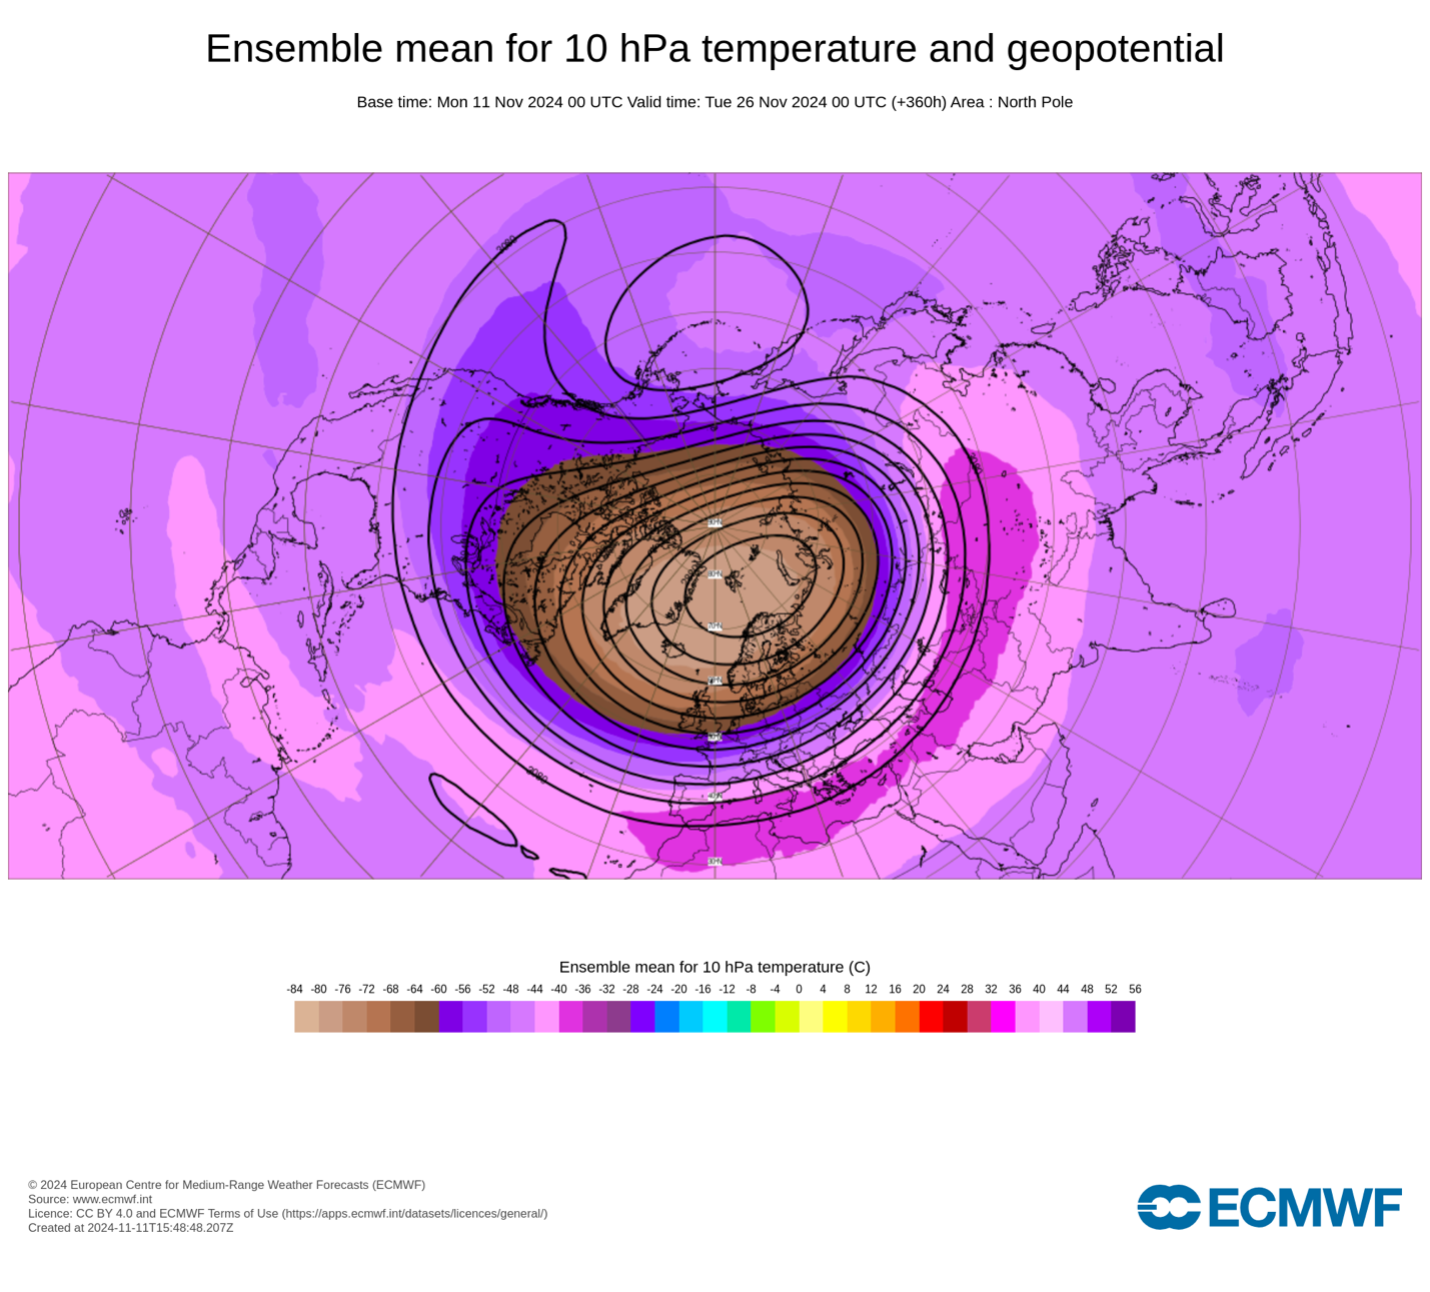
Figure iv. Predicted 10 mb geopotential heights (dam; contours) and temperature anomalies (°C; shading) across the Northern Hemisphere for 26 November 2024. The forecasts are from the 00Z 11 November 2024 ECMWF model ensemble.
I should mention that I am on travel through next Monday so please do expect disruptions, delays and even more typos to the blog updates.
Wednesday Update
It has been a “love me, love me not situation” from the models this week. On Sunday the models were mostly predicting a Siberian ridging and ever strengthening PV except for the ECMWF, which was alone in predicting Ural ridging and a stretched PV. Then by Monday the models all seemed to lurch towards the ECMWF with both the Ural ridging and the stretched PV. Today the models show both the Ural ridging and stretched PV to be transient and are once again lurching back to the Siberian ridging (see Figure v) and the strengthening PV, with one big exception, the operational ECMWF. It is newly upgraded so a good first test if the money and effort were worth it. But given that even the ECMWF ensembles don’t agree with it, I am considering it an outlier forecast and one of low probability, at least for now. If the model forecasts of transient Ural blocking quickly evolving into Siberian ridging, then I would expect a strong PV for a while and likely an overall mild to very mild month of December for the NH.
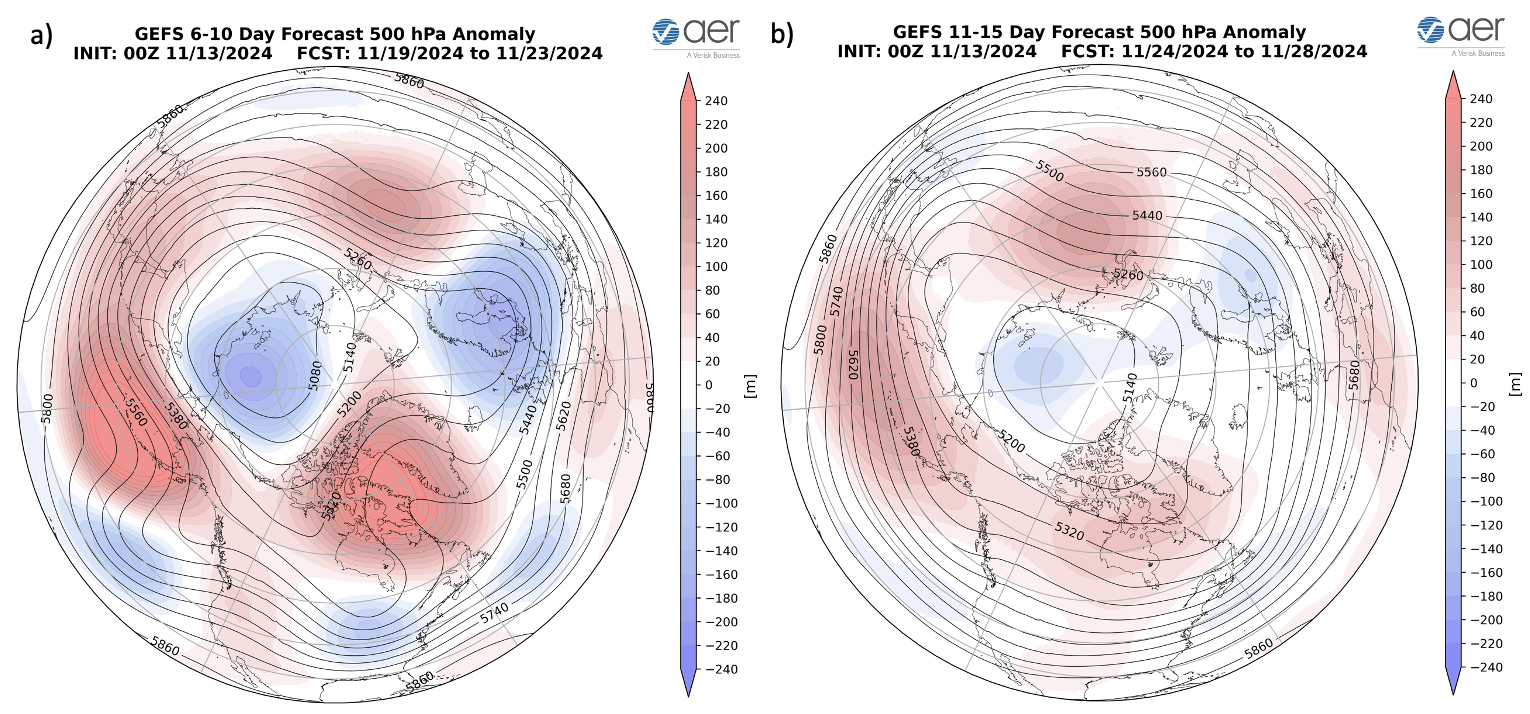
Figure v. (a) Forecasted average 500 mb geopotential heights (dam; contours) and
geopotential height anomalies (m; shading) across the Northern Hemisphere from 19 – 23
November 2024. (b) Same as (a) except forecasted averaged from 24 – 28 November 2024. The forecasts are from the 00Z 13 November 2024 GFS model ensemble.
All in all, I think the forecasts are volatile and of low confidence. I still maintain what happens in the next several weeks will be critical for the winter as a whole and despite the most recent model forecasts, I think the low sea ice in the Barents-Kara seas may just anchor the ridging closer to the Urals. Maybe that is just wishcasting on my part but should be an interesting few days to model gaze.
Near-Term
This week
The AO is predicted to be neutral this week (Figure 1) with mixed to mostly negative geopotential height anomalies across the Arctic and with mixed geopotential height anomalies across the mid-latitudes of the NH (Figure 2). With predicted negative geopotential height anomalies across Greenland (Figure 2), the NAO is predicted to be positive this week.
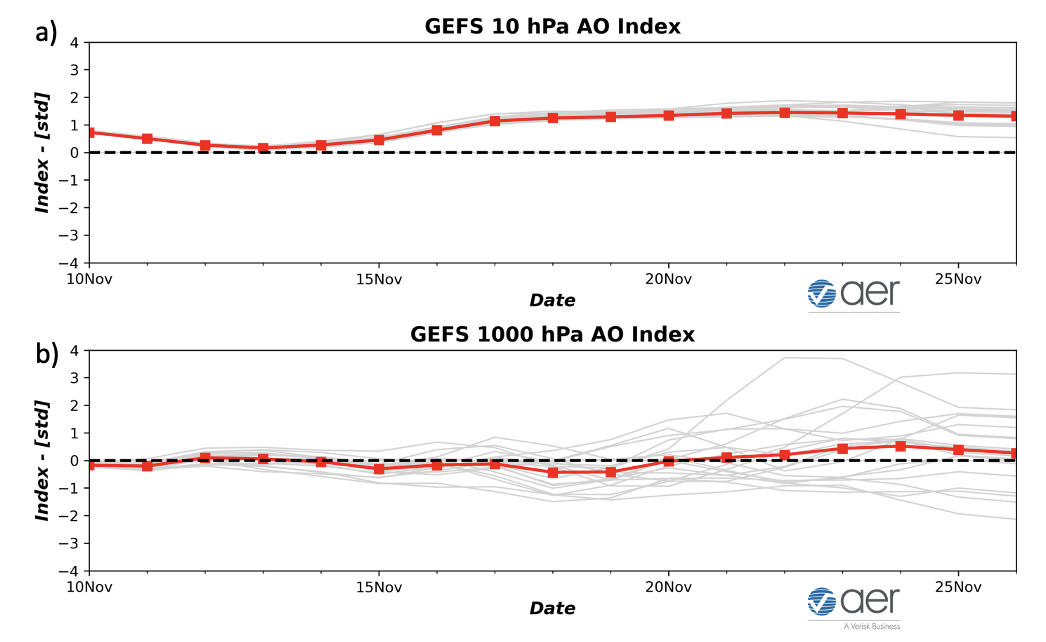
Figure 1. a) The predicted daily-mean AO at 10 hPa from the 00Z 10 November 2024 GFS ensemble. b) The predicted daily-mean AO at 1000 hPa from the 00Z 10 November 2024 GFS ensemble. Gray lines indicate the AO index from each individual ensemble member, with the ensemble mean AO index given by the red line with squares.
This week, ridging/positive geopotential height anomalies west of the British Isles will support ridging/positive geopotential height anomalies centered on Western Europe (Figures 2). This pattern will favor normal to below normal temperatures across Western Europe including the UK with normal to above normal temperatures across Eastern Europe (Figure 3). This week the predicted pattern across Asia is ridging/positive geopotential height anomalies centered over the Central Arctic forcing troughing/negative geopotential height anomalies across Central and Northern Asia and more ridging across Southern and Eastern Asia (Figure 2). This pattern favors normal to above normal temperatures across much of Asia with normal to below normal temperatures limited to parts of Siberia and Kazakhstan (Figure 3).
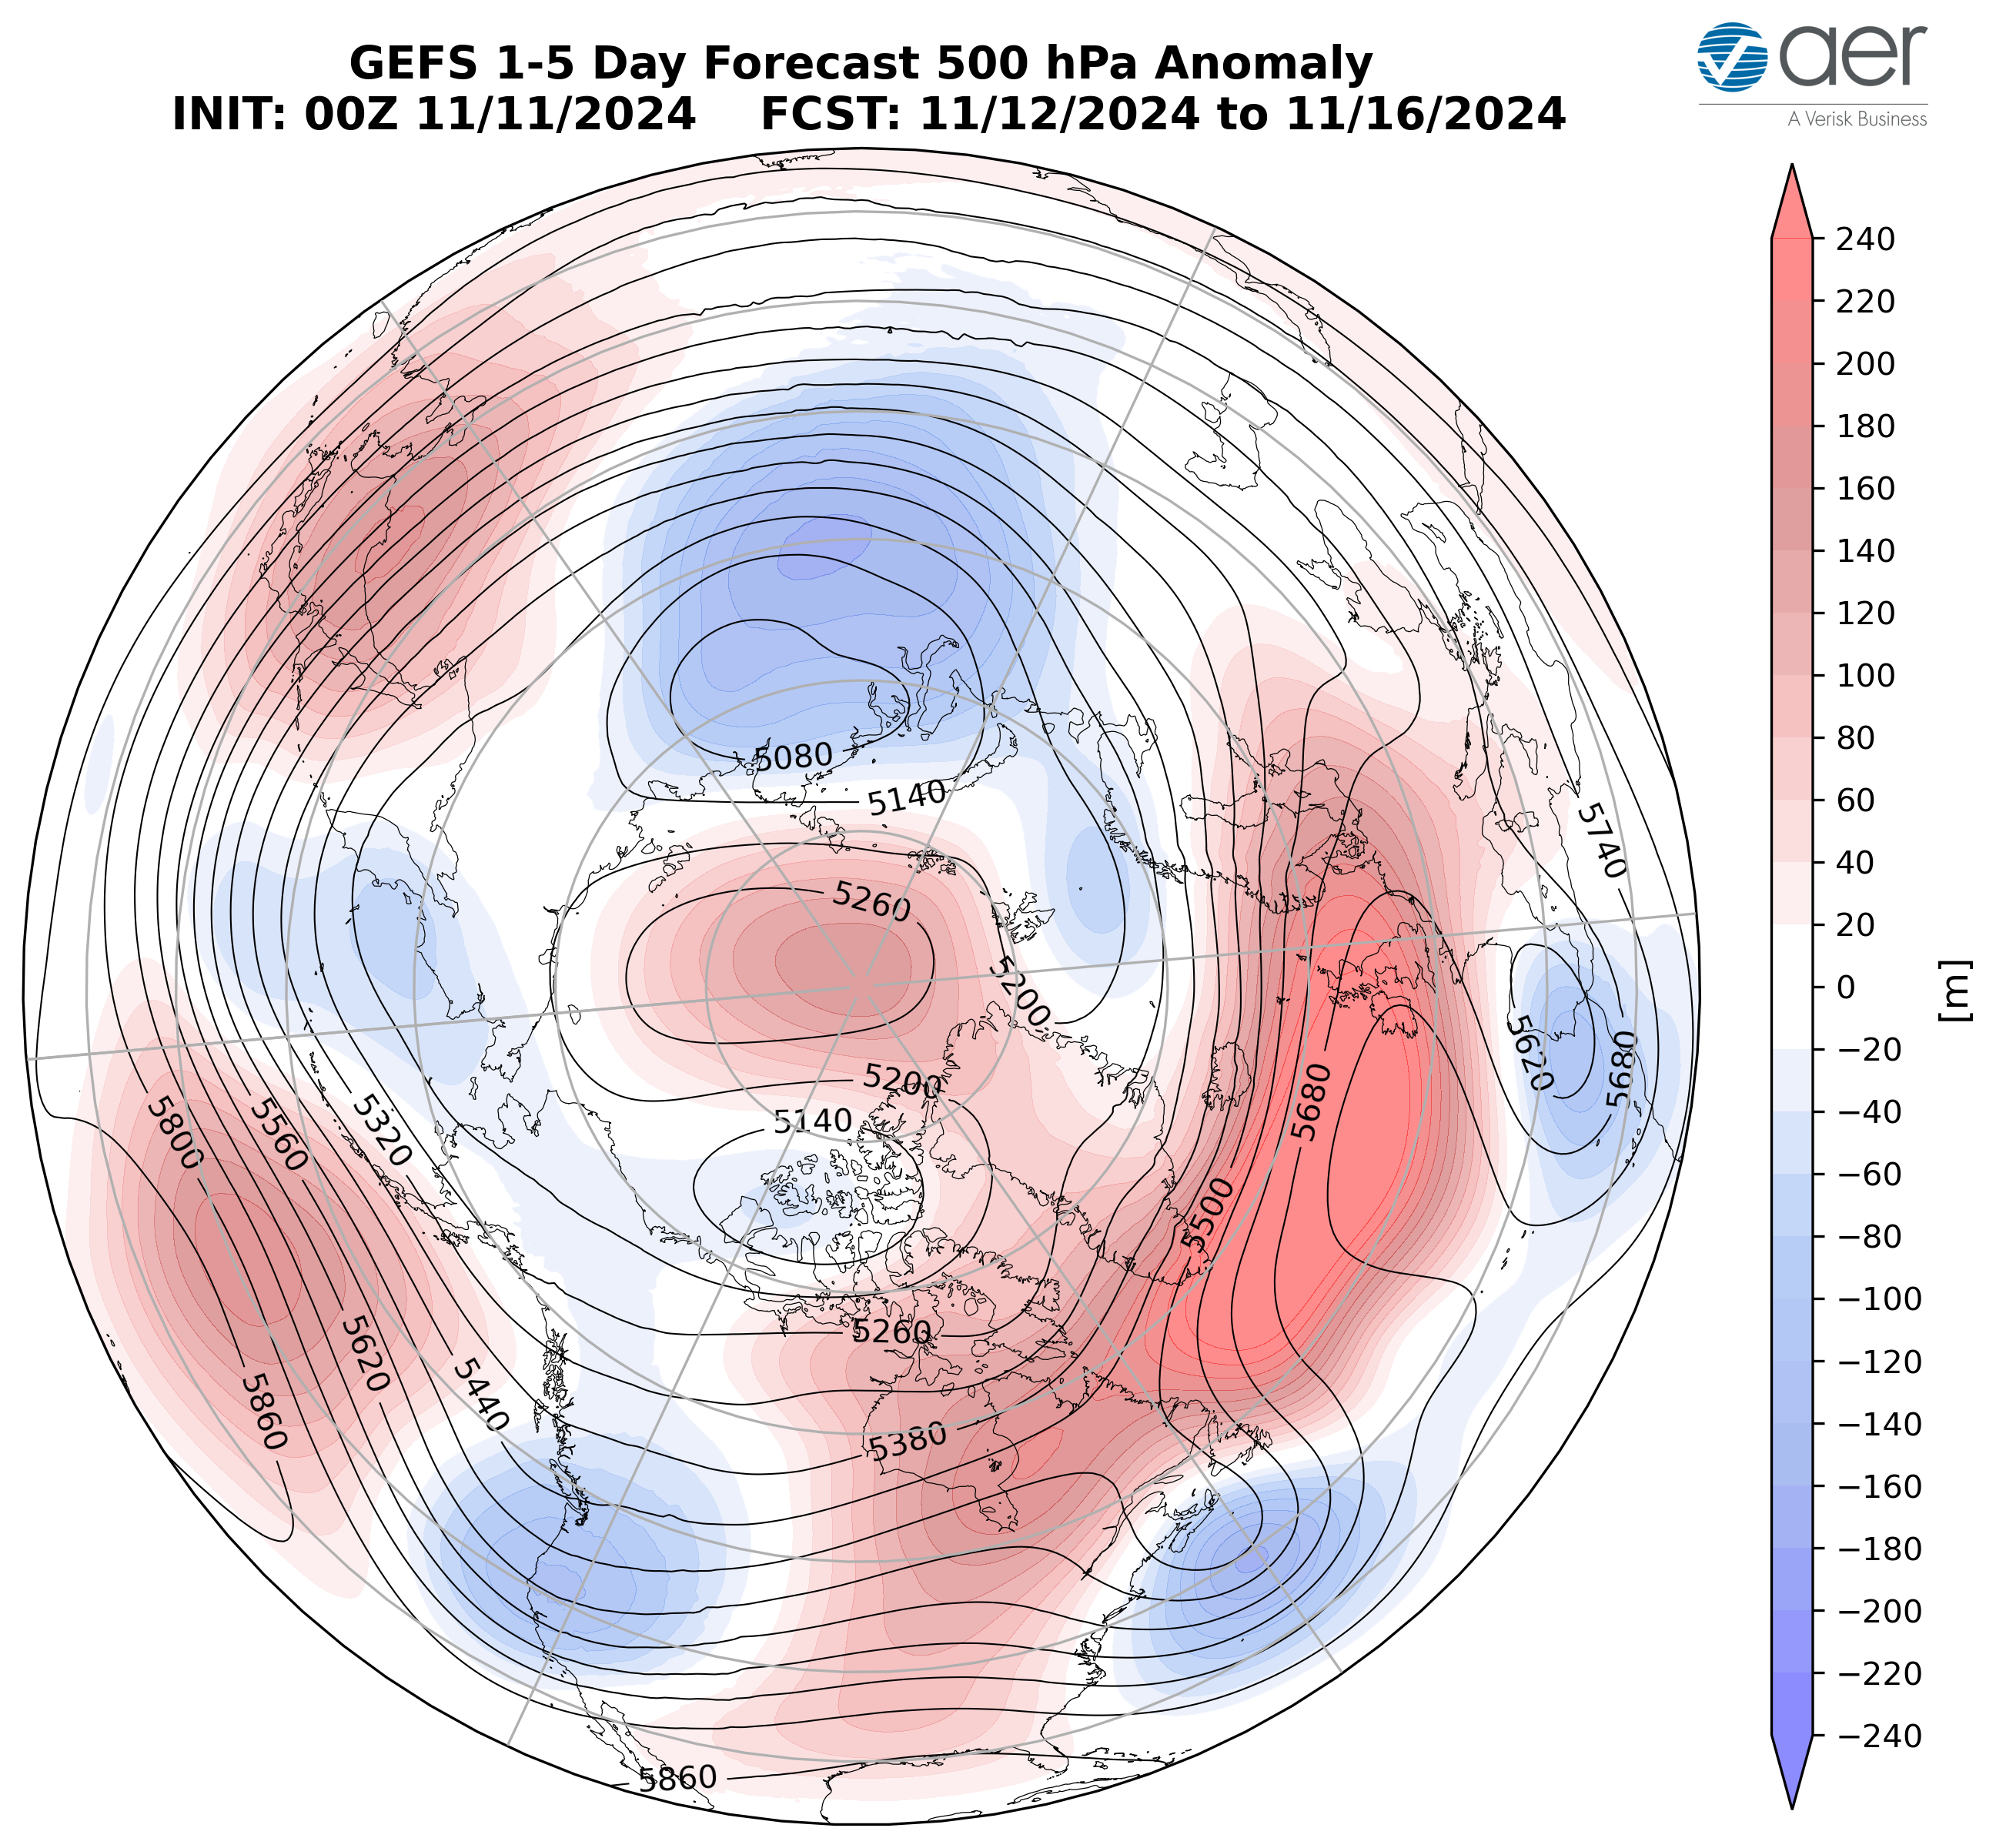
Figure 2. Forecasted average 500 mb geopotential heights (dam; contours) and geopotential height anomalies (m; shading) across the Northern Hemisphere from 12 – 16 November 2024. The forecasts are from the 00z 11 November 2024 GFS ensemble.
This week ridging/positive geopotential height anomalies south of the Aleutians will force troughing/negative geopotential height anomalies across Alaska, Western Canada and the Western US with more ridging/positive geopotential height anomalies across Eastern Canada and the Eastern US. (Figure 2). This pattern will favor normal to below normal temperatures across Alaska, Western Canada and the Western US with normal to above normal temperatures across Eastern Canada and the Eastern US (Figure 3).

Figure 3. Forecasted surface temperature anomalies (°C; shading) from 12 – 16 November 2024. The forecast is from the 00Z 11 November 2024 GFS ensemble.
Troughing and/or cold temperatures will support new snowfall across Norway, Siberia, Central Asia and the Tibetan Plateau while warm temperatures will support snowmelt in Western Russia this week (Figure 4). Troughing and/or cold temperatures will support new snowfall across southern Alaska, Northern Canada and the higher elevations of the Western US while warm temperatures will support snowmelt in the Canadian Plains and Colorado this week (Figure 4).

Figure 4. Forecasted snow depth changes (mm/day; shading) from 12 – 16 November 2023. The forecast is from the 00Z 11 November 2024 GFS ensemble.
Near-Mid Term
Next week
With geopotential height anomalies remaining mixed across the Arctic and with mixed geopotential height anomalies across the mid-latitudes this period (Figure 5), the AO will likely be close to neutral this period (Figure 1). With predicted strengthening positive pressure/geopotential height anomalies across Greenland (Figure 5), the NAO will likely turn negative this period.
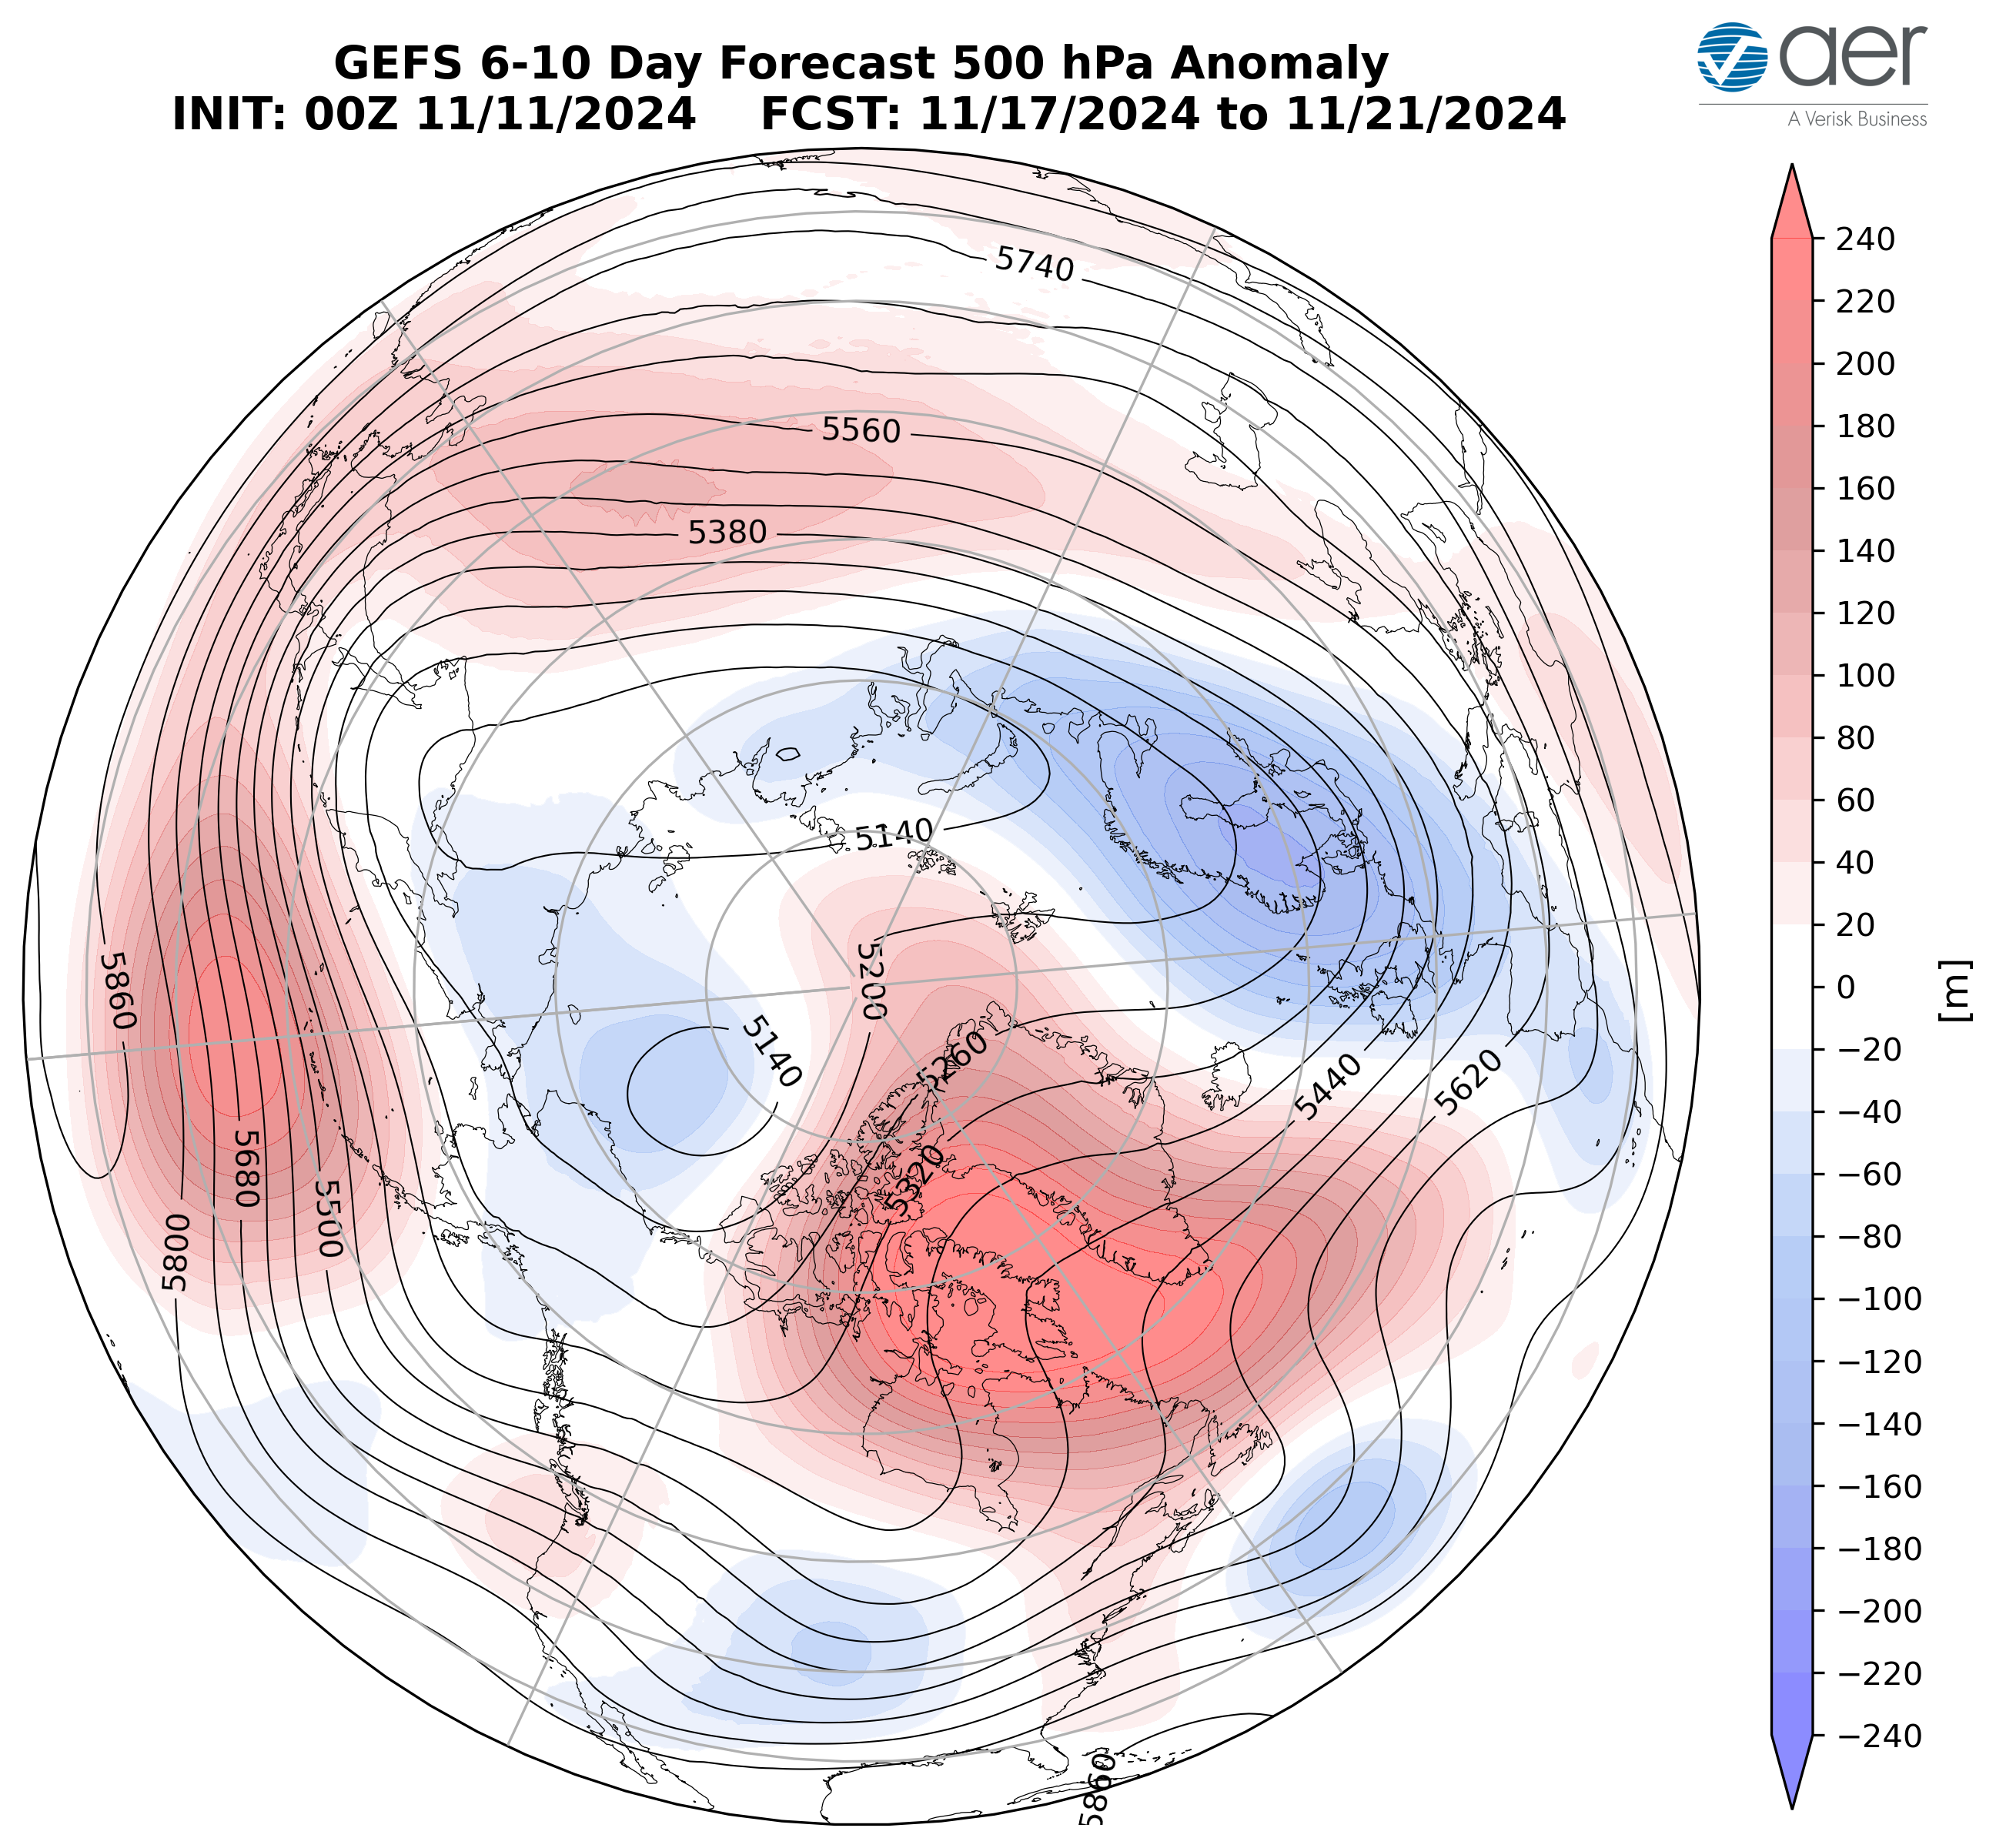
Figure 5. Forecasted average 500 mb geopotential heights (dam; contours) and geopotential height anomalies (m; shading) across the Northern Hemisphere from 17 – 21 November 2024. The forecasts are from the 00z 11 November 2024 GFS ensemble.
Strengthening ridging/positive geopotential height anomalies across Greenland will continue to support troughing/negative geopotential height anomalies across Europe but especially Northwestern Europe with southwesterly flow Southeastern Europe this period (Figure 5). This pattern will favor normal to below normal temperatures across Northern and Western Europe including the UK while induced southwesterly flow will usher in normal to above normal temperatures across Southeastern Europe (Figure 6). The predicted pattern across Asia is ridging/positive geopotential height anomalies over Greenland forcing troughing/negative geopotential height anomalies across the Urals and Northern Asia with more ridging/positive geopotential height anomalies across East Asia (Figure 5). This pattern favors widespread normal to above normal temperatures across much of Asia with normal to below normal temperatures limited to Northern Siberia (Figure 6).
 Figure 6. Forecasted surface temperature anomalies (°C; shading) from 17 – 21 November 2024. The forecasts are from the 00z 11November 2024 GFS ensemble.
Persistent ridging/positive geopotential height anomalies near the Aleutians will continue to support troughing/negative geopotential height anomalies across Alaska, Western Canada and the Western US with more ridging/positive geopotential height anomalies across Eastern Canada and the Eastern US this period (Figure 5). This pattern will favor normal to below normal temperatures across Alaska, Western Canada, the Western US with normal to above normal temperatures across Eastern Canada and the Eastern US (Figure 6).

Figure 7. Forecasted snow depth changes (mm/day; shading) from 17 – 21 November 2024. The forecasts are from the 00z 11 November 2024 GFS ensemble.
Troughing and/or cold temperatures will support new snowfall across Scandinavia, the Alps, the Urals, Siberia and parts of China while warm temperatures will support snowmelt in Kazakhstan and the Tibetan Plateau this period (Figure 7). Troughing and/or cold temperatures will support new snowfall across Alaska, Western and Central Canada, the Cascades and the Northern Rockies while warm temperatures will support snowmelt in the Canadian Rockies this period (Figure 7).
Mid Term
Week Two
With predicted mixed to negative geopotential height anomalies across the Arctic and mixed geopotential height anomalies across the mid-latitudes this period (Figure 8), the AO will likely persist near neutral or even positive (Figure 1). With predicted positive to mixed pressure/geopotential height anomalies across Greenland (Figure 8), the NAO will likely be close to neutral this period as well.
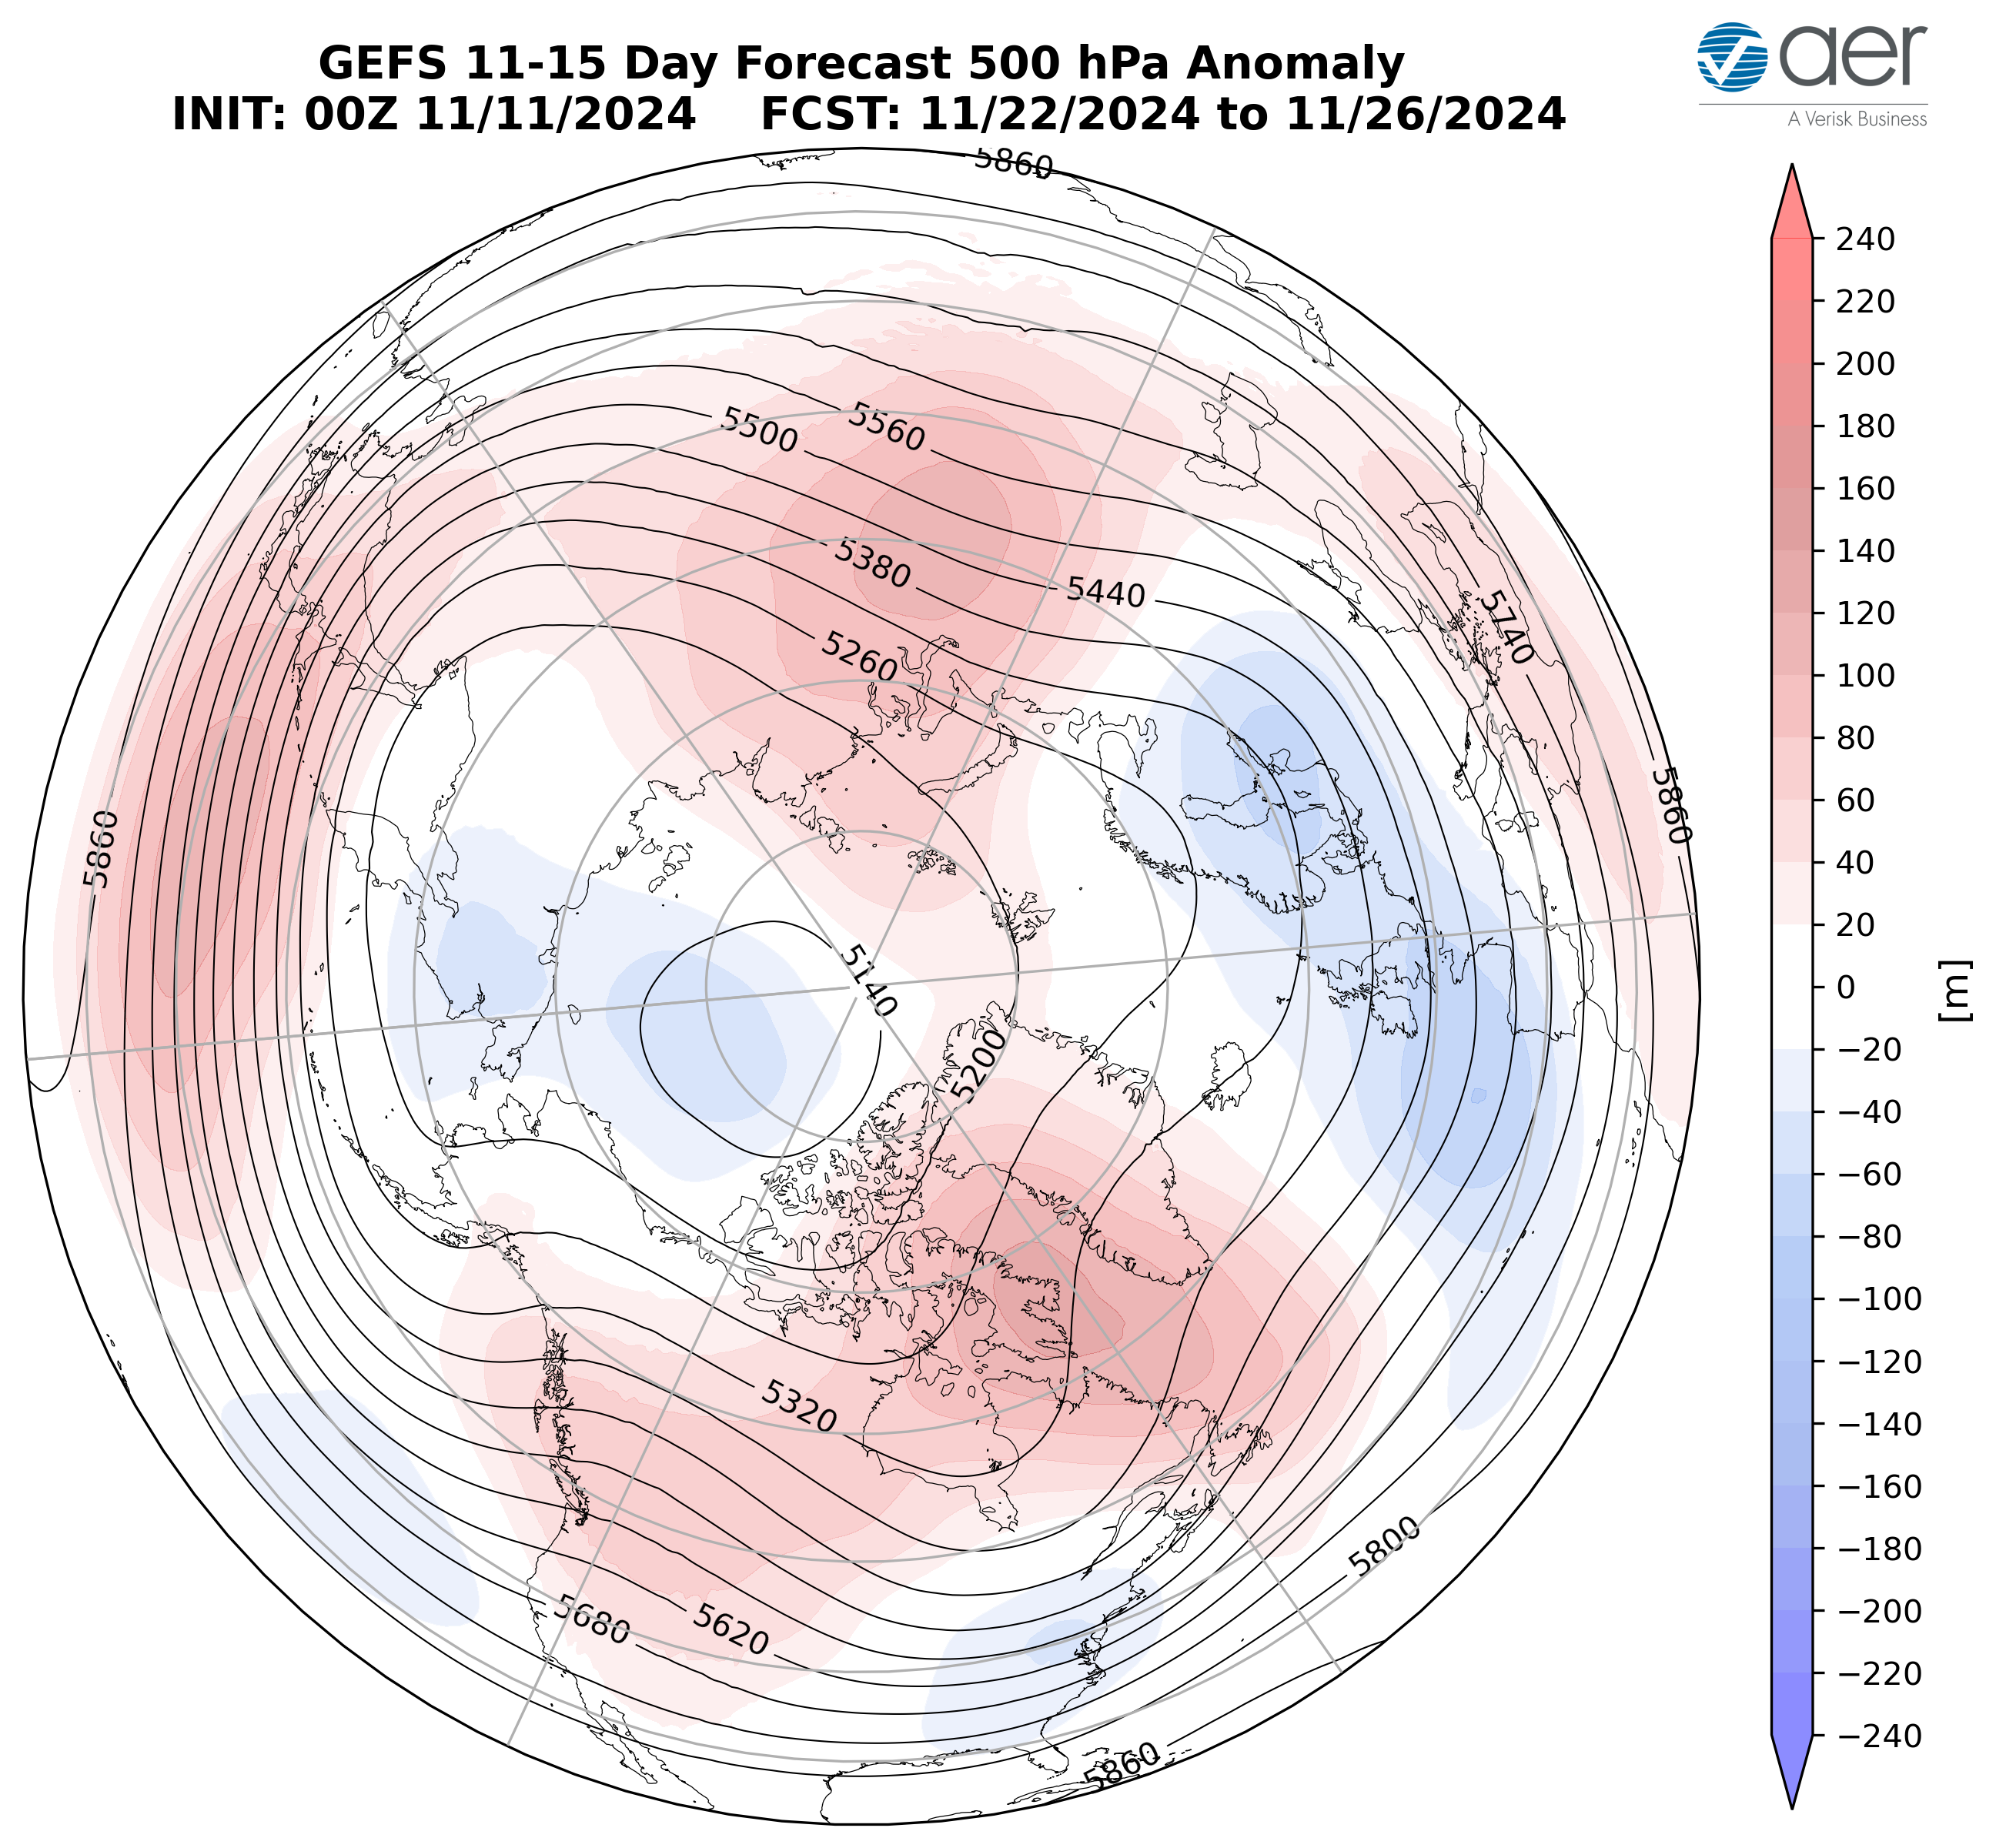
Figure 8. Forecasted average 500 mb geopotential heights (dam; contours) and
geopotential height anomalies (m; shading) across the Northern Hemisphere from 22 – 26
November 2024. The forecasts are from the 00z 11 November 2024 GFS ensemble.
Weakening ridging/positive geopotential height anomalies across Greenland is predicted to continue to support troughing/negative geopotential height anomalies across Europe this period (Figure 8). This pattern should favor normal to below normal temperatures across much of Europe including the UK with normal to below normal temperatures limited to far Southeastern Europe this period (Figures 9). The predicted pattern across Asia this period is ridging/positive geopotential height anomalies widespread across Southern and Eastern Asia and centered on Eastern China with troughing/negative geopotential height anomalies limited to Northern Siberia this period (Figure 8). The predicted pattern favors widespread normal to above normal temperatures across much of Asia with normal to below normal temperatures limited to parts of Northern and Eastern Siberia this period (Figure 9).

Figure 9. Forecasted surface temperature anomalies (°C; shading) from 22 – 26 November 2024. The forecast is from the 00Z 11 November 2024 GFS ensemble.
Predicted troughing/negative across near the Dateline will support increasing ridging/positive geopotential height anomalies across Canada with weak troughing/negative geopotential height anomalies across the US this period (Figure 8). This pattern will favor widespread normal to below normal temperatures across much of Alaska, Northwestern Canada and possibly the Eastern US with normal to above normal temperatures across most of Canada and the Western US this period (Figure 9).

Figure 10. Forecasted snow depth changes (mm/day; shading) from 22 – 26 November 2024. The forecast is from the 00Z 11 November 2024 GFS ensemble
Troughing and/or cold temperatures will support new snowfall across Scandinavia, the Alps, Northwest Russia and Siberia this week (Figure 10). Troughing and/or cold temperatures will support new snowfall across Alaska, Northern, Western and Eastern Canada, the higher elevations of the Northwestern US this week (Figure 10).
Longer Term
30–day
The latest plot of the polar cap geopotential height anomalies (PCHs) currently shows normal to warm/positive PCHs in the lower stratosphere and the upper -troposphere with cold/negative PCHs in the upper stratosphere and neutral in the lower troposphere (Figure 11). This week and into next week warm/positive mid tropospheric PCHs are predicted to descend close to the surface while cold/negative PCHs are predicted to expand into the mid-and lower stratosphere and then eventually all the way to the surface (Figure 11). This suggests coupling between a strong stratospheric PV and a positive AO that favors an overall mild pattern across the NH.
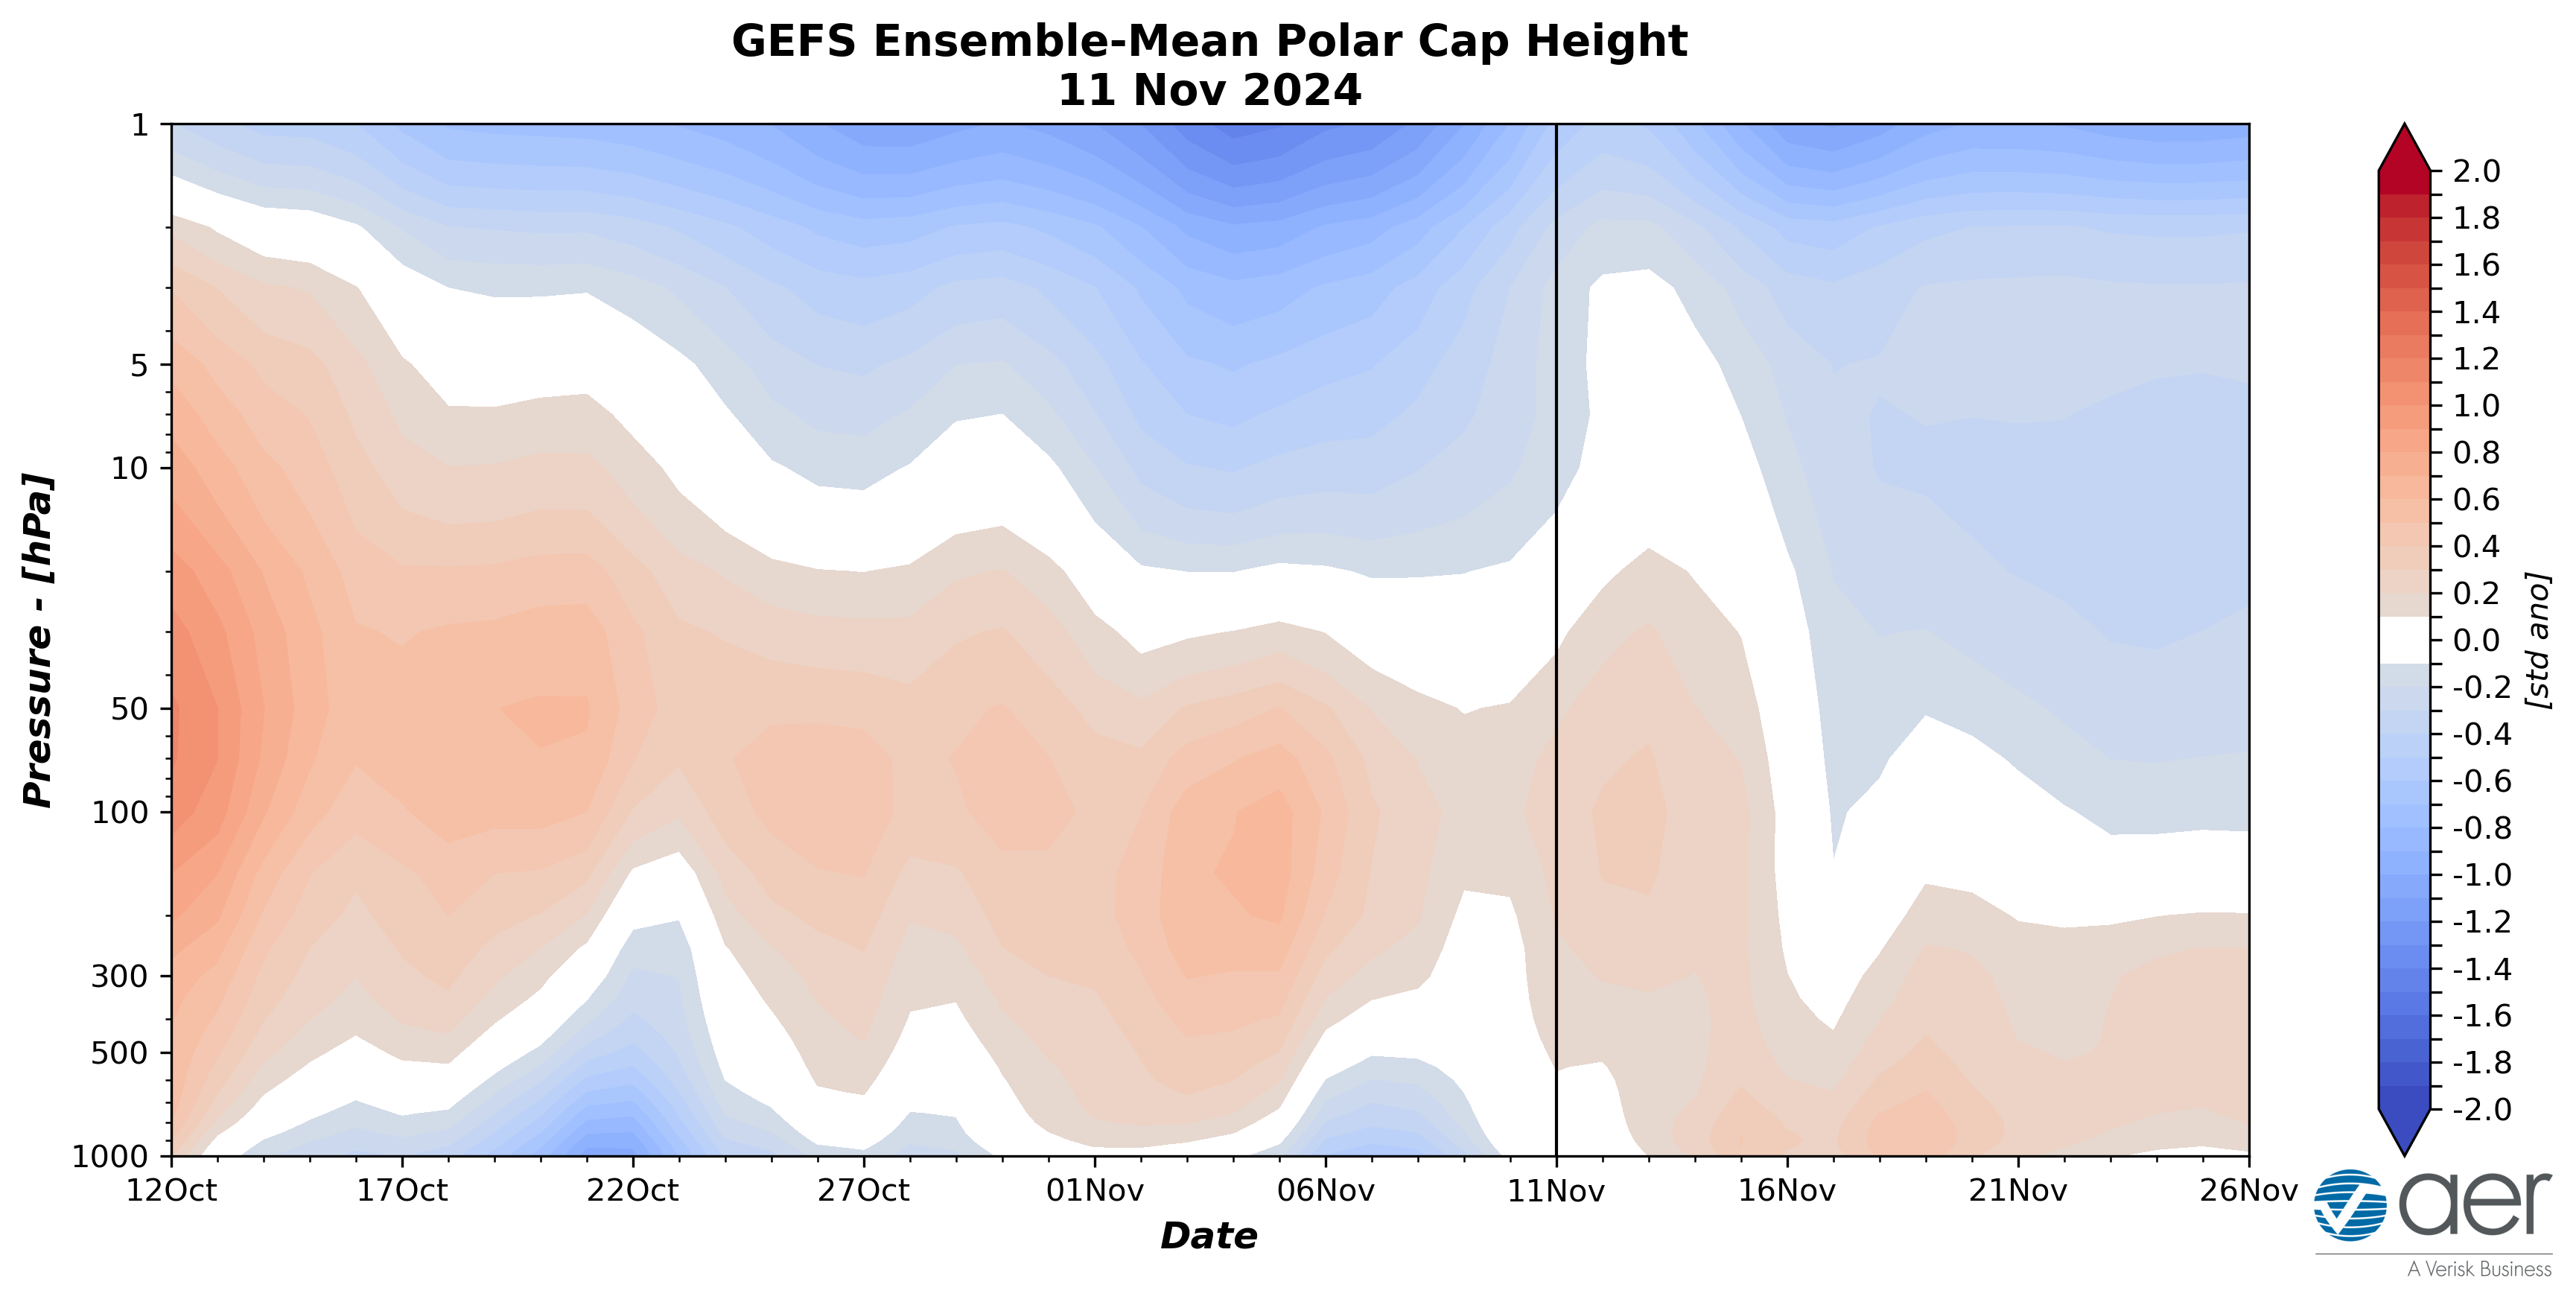
Figure 11. Observed and predicted daily polar cap height (i.e., area-averaged
geopotential heights poleward of 60°N) standardized anomalies. The forecast is from the 00Z 11 November 2024 GFS ensemble.
The predicted neutral PCHs in the lower troposphere this week (Figure 11) are consistent with the predicted neutral surface AO this week (Figure 1). However, the AO is predicted to become more biased negative next week (Figure 1) coinciding with the predicted descending of warm/positive PCHs into the lower troposphere (Figure 11).
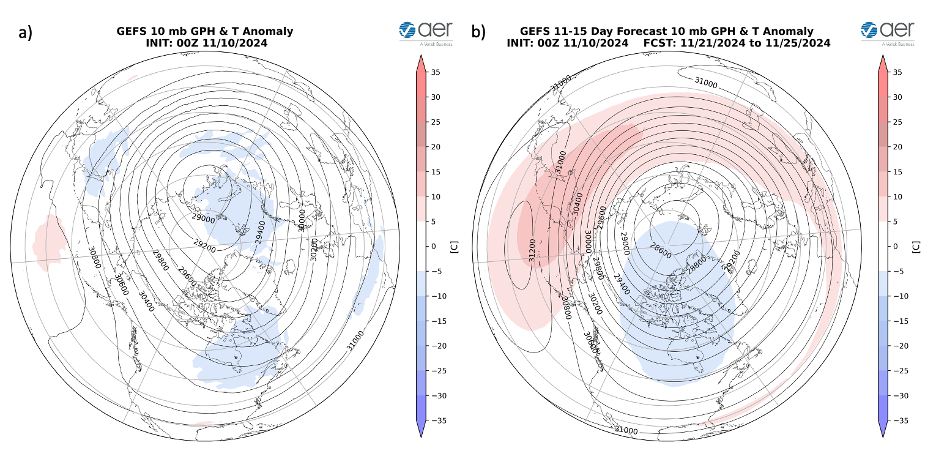
Figure 12. (a) Initialized 10 mb geopotential heights (dam; contours) and temperature anomalies (°C; shading) across the Northern Hemisphere for 10 Nov 2024. (b) Same as (a) except forecasted averaged from 21 – 25 November 2024. The forecasts are from the 00Z 10 November 2024 GFS model ensemble.
This week the polar vortex (PV) is predicted to be nearly circular in shape with the PV center between the North Pole and the Kara Sea with relatively cold temperatures focused in the Arctic (Figure 12a). This is consistent with a relatively strong PV. Then, for the fourth week of November the PV center is predicted to remain between the North Pole and the Kara Sea and maintain its mostly circular shape with warming extending out of Asia towards Alaska in the polar stratosphere (Figure 12b). This still resembles a strong PV configuration, and I included the stratospheric AO in Figure 1 this week to show just how much strengthening of the PV is being predicted by the GFS. But other models are more suggestive of an eventual minor disruption. And even more recent forecasts of the GFS do show more of a stretched PV configuration that could finally bring some cold air to the Eastern US.
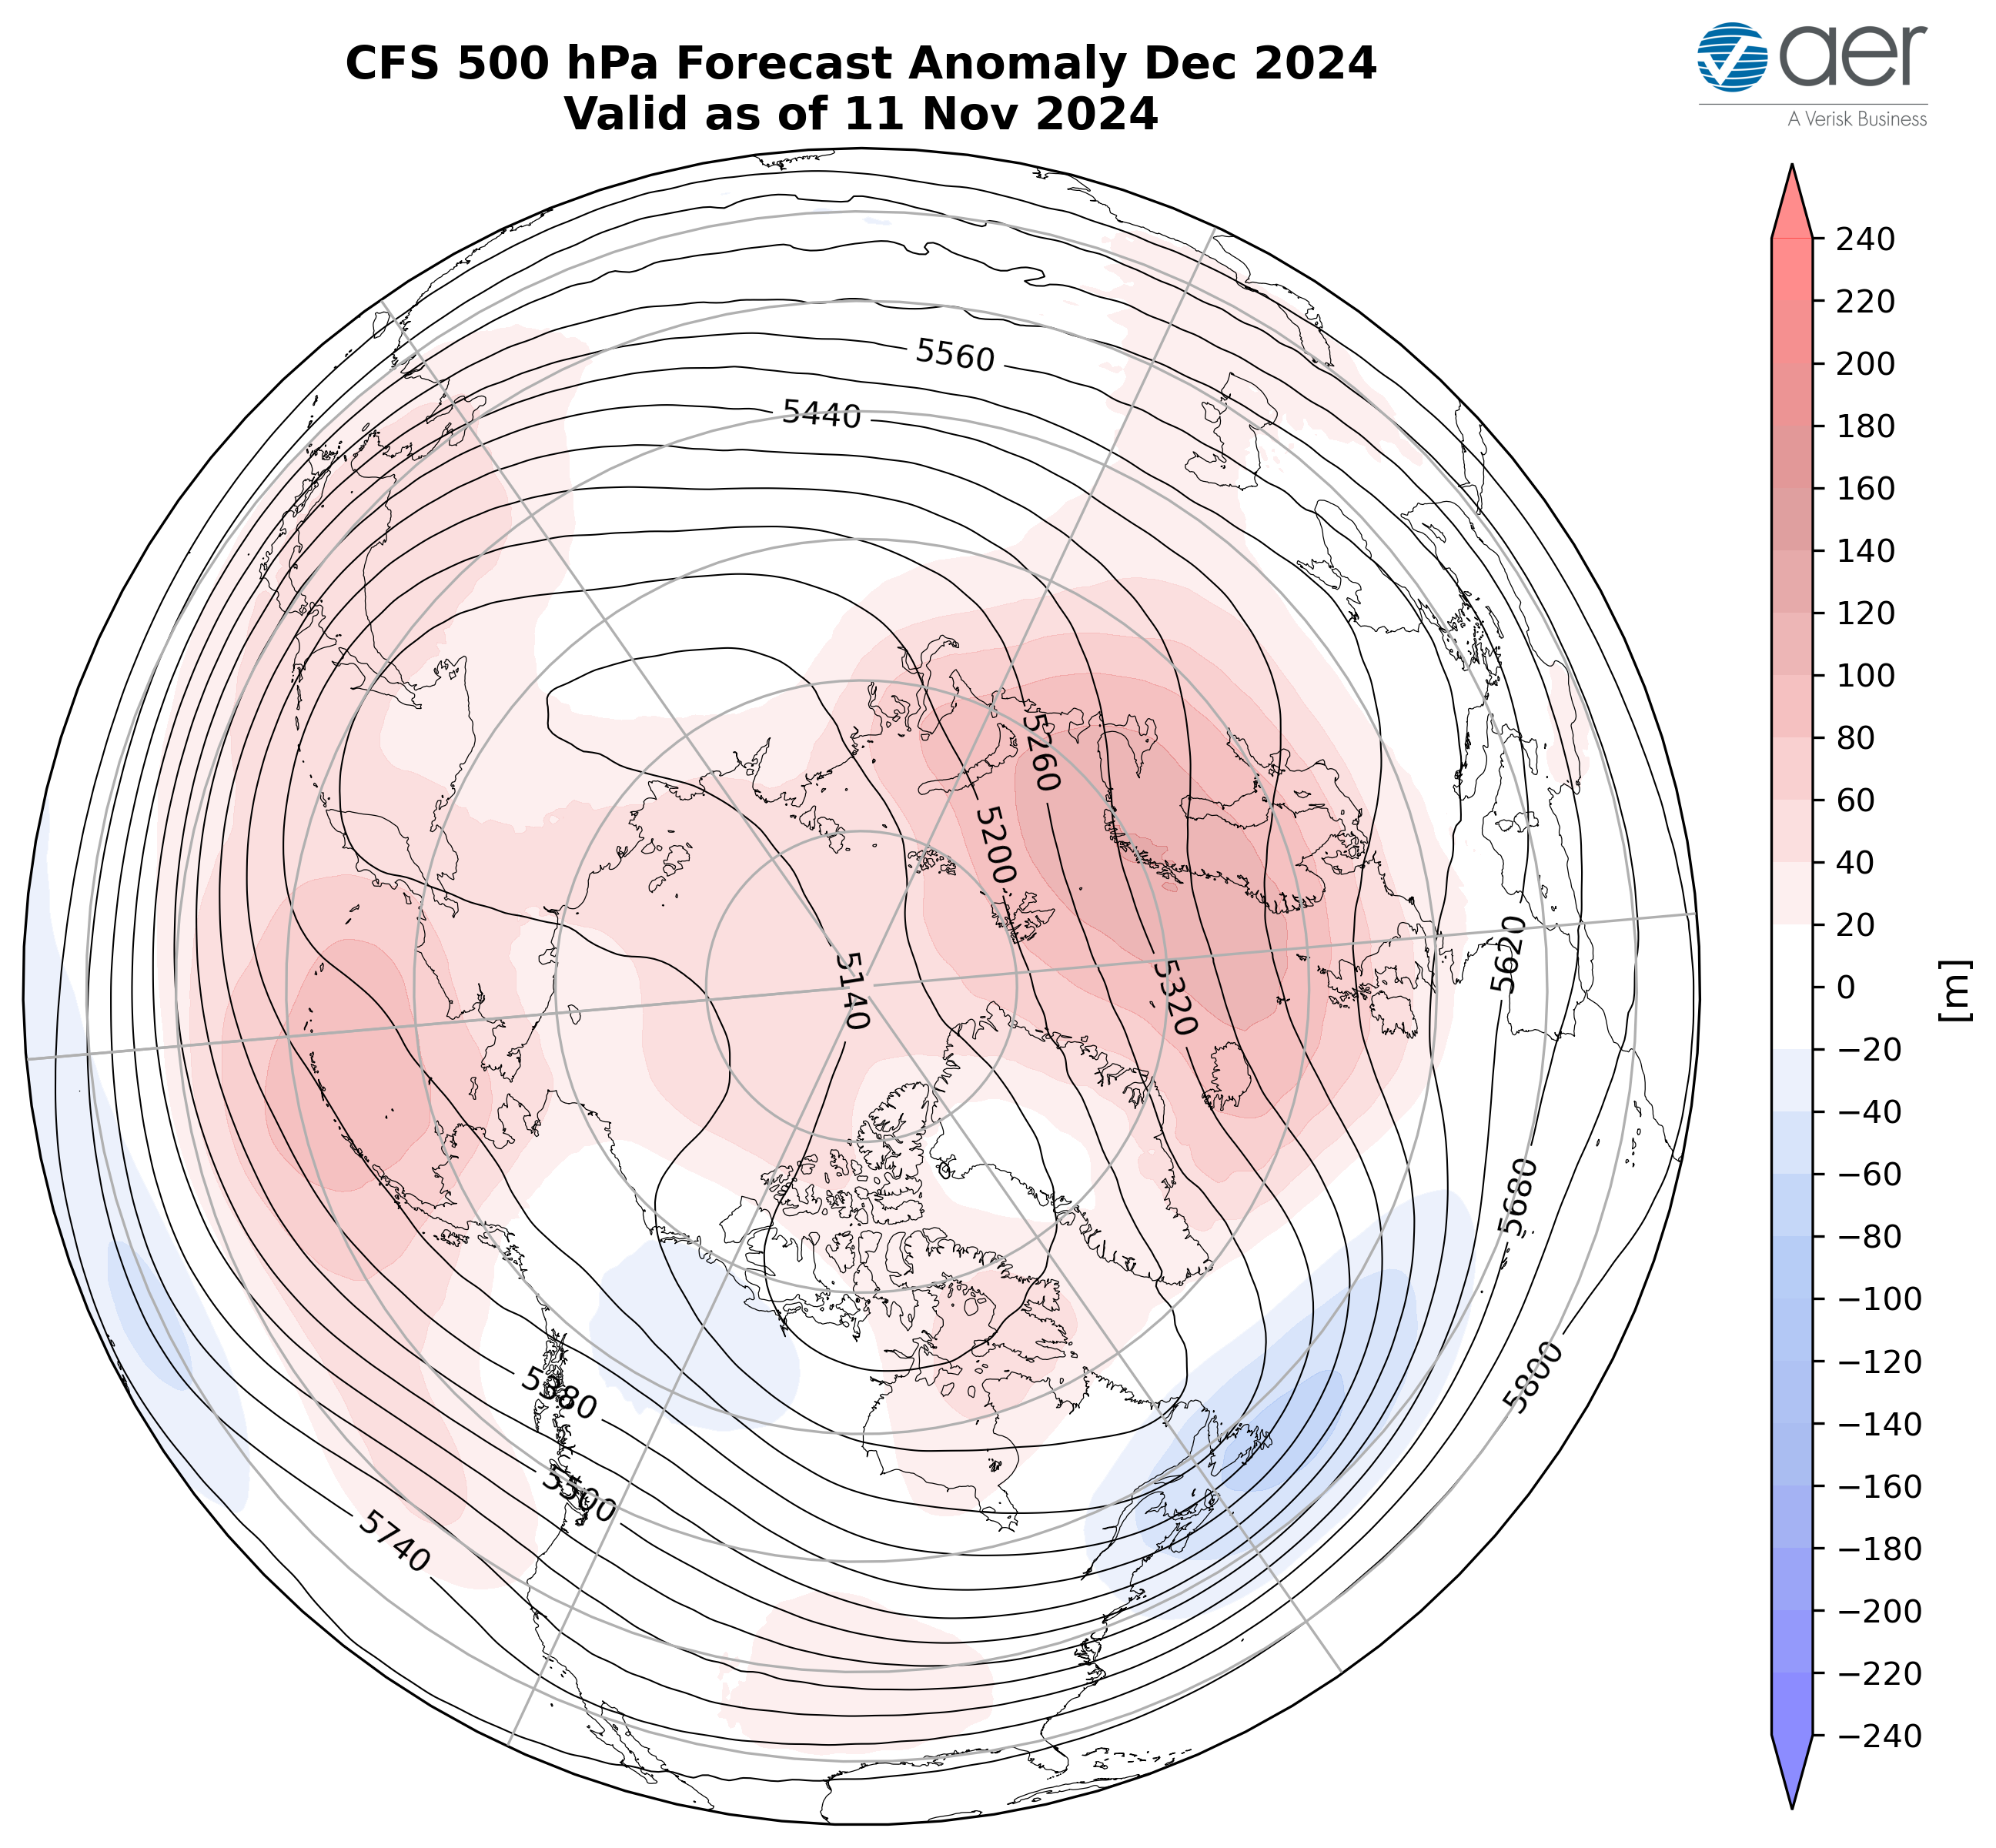
Figure 13. Forecasted average 500 mb geopotential heights (dam; contours) and geopotential height anomalies (m; shading) across the Northern Hemisphere for December 2024. The forecasts are from the 00Z 11 November 2024 CFS.
I include in this week’s blog the monthly 500 hPa geopotential heights (Figure 13) and surface temperatures for December (Figure 14) from the Climate Forecast System (CFS; the plots represent yesterday’s four ensemble members). The forecast for the troposphere is ridging in the Eurasian Arctic, the UK and Western Europe, the Gulf of Alaska extending into Alaska with troughing spreading across Eastern Europe and Western Russia, Siberia extending into East Asia the Dateline, Eastern Canada and the Eastern US (Figure 13). This pattern favors seasonable to relatively warm temperatures across Northern and Western Europe, Southern Asia, Eastern Siberia, Alaska, Western Canada, the Western US with seasonable to relatively cold temperatures across Eastern Europe, Western Russia, Siberia especially in the north, Northeast Asia, Eastern Canada and the Eastern US (Figure 14).
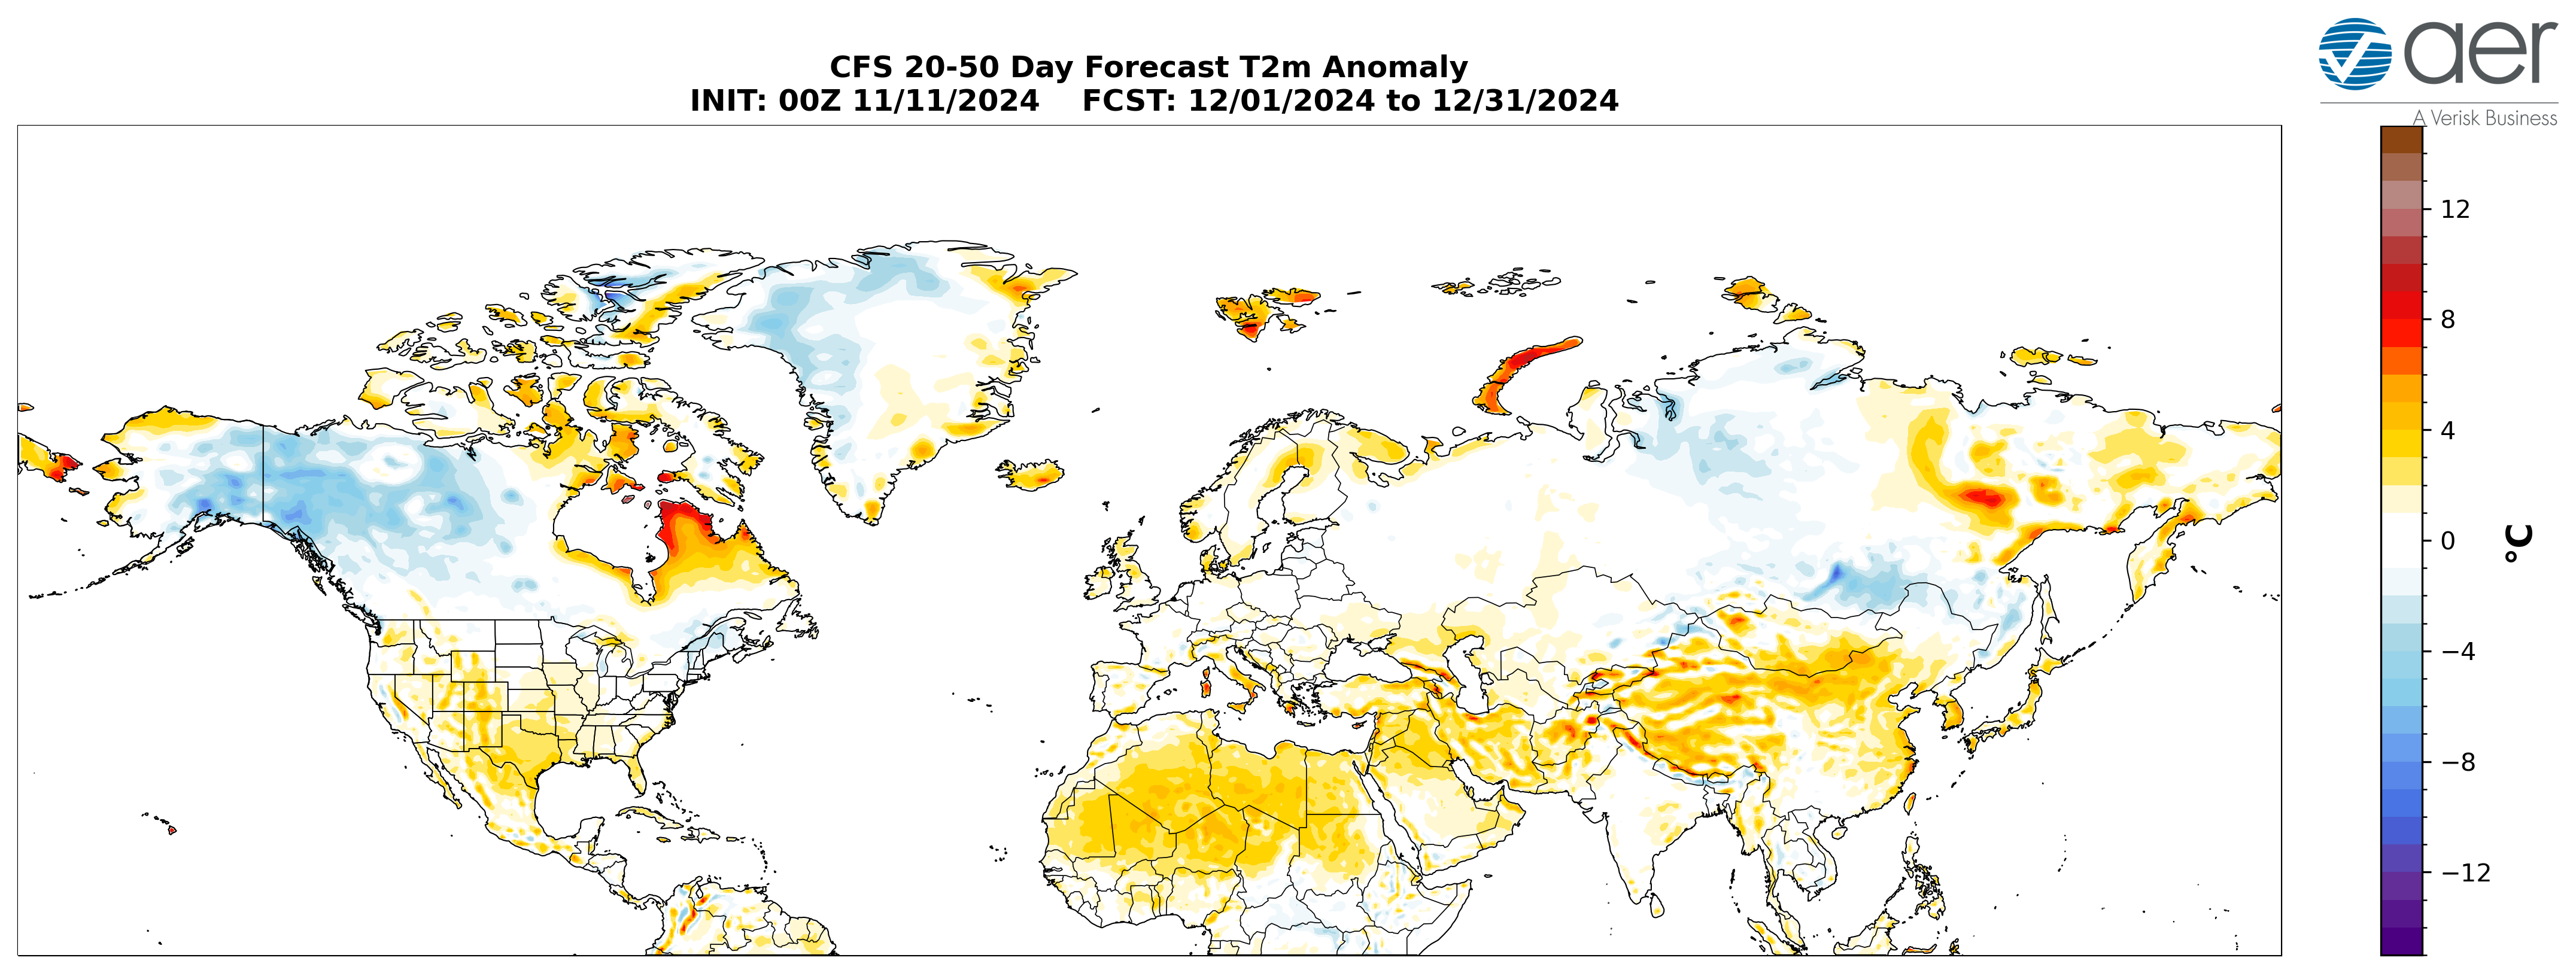
Figure 14. Forecasted average surface temperature anomalies (°C; shading) across
the Northern Hemisphere for December 2024. The forecasts are from the 00Z 11 November 2024 CFS.
Boundary Forcings
SSTs/El Niño/Southern Oscillation
Equatorial Pacific sea surface temperatures (SSTs) anomalies are below normal, between the Dateline and the South America coast, indicating that a La Niña event is emerging (Figure 15) and weak La Niña conditions are expected through the winter. Observed SSTs across the NH remain well above normal especially in the central North Pacific centered on the Dateline and the western North Pacific, much of the North Atlantic and offshore of eastern North America though below normal SSTs exist regionally especially in the South Pacific.
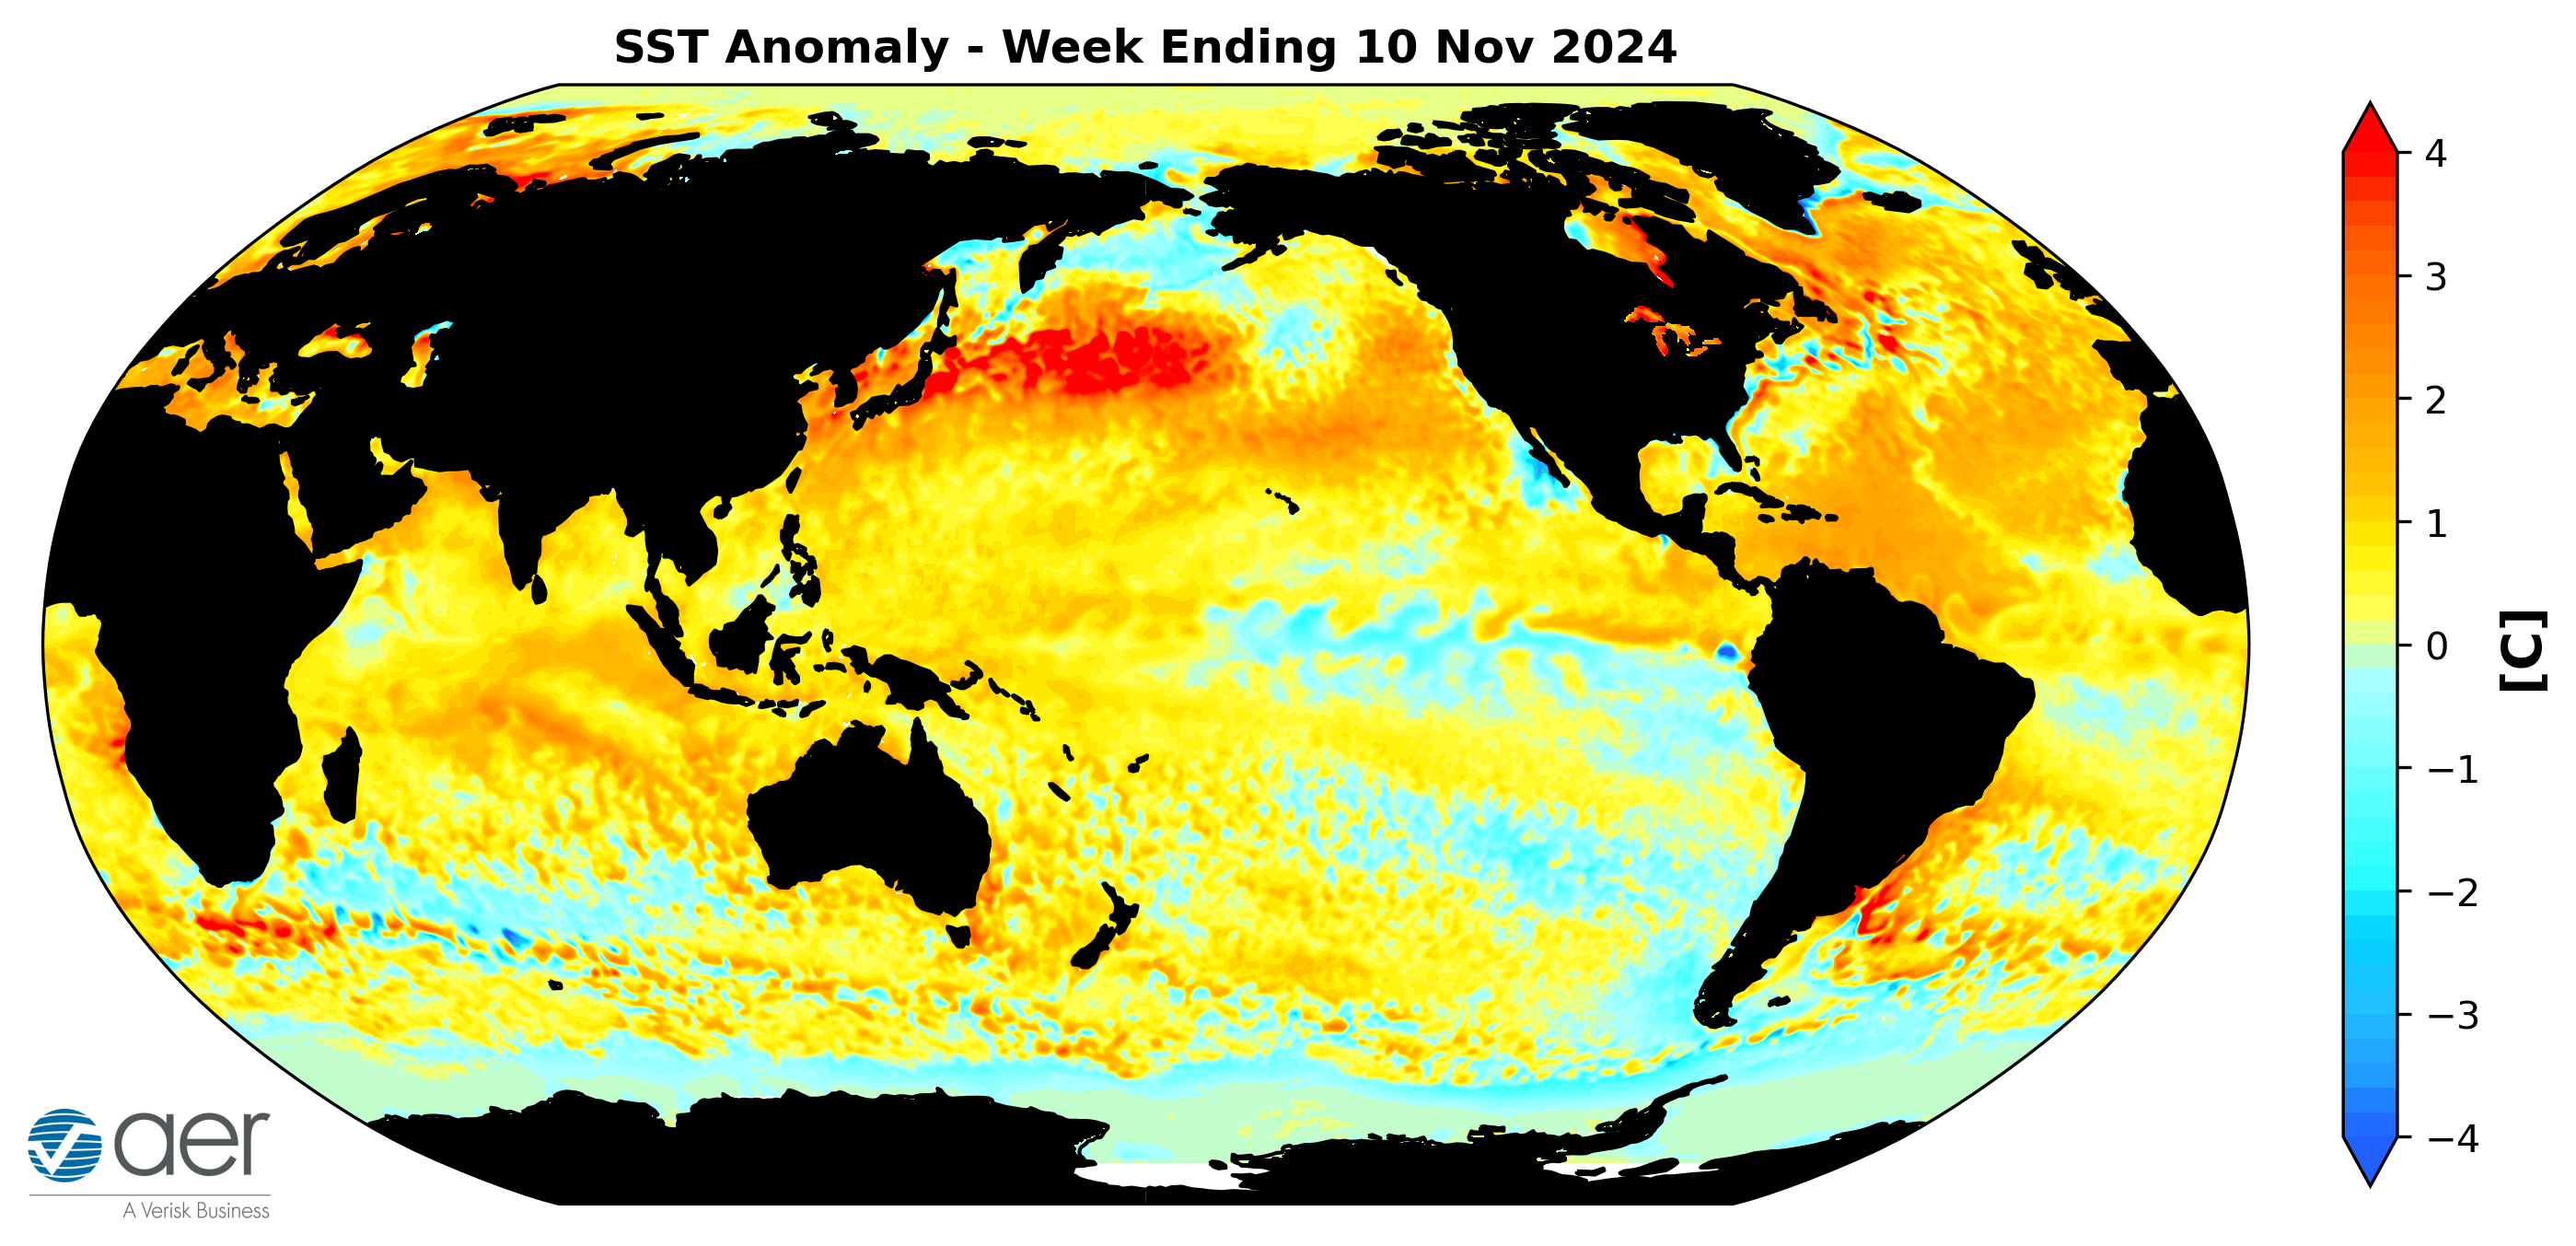
Figure 15. The latest daily-mean global SST anomalies (ending 10 November 2024).
Data from NOAA OI High-Resolution dataset. Source: https://psl.noaa.gov/map/clim/sst.shtml
Madden Julian Oscillation
Currently the Madden Julian Oscillation (MJO) is currently weak where no phase is favored (Figure 16). The forecasts are for the MJO to remain weak where no phase is favored. Therefore, it seems that the MJO is having little influence on North American weather next week. But admittedly this is outside of my expertise.

Figure 16. Past and forecast values of the MJO index. Forecast values from the 00Z 10 November 2024 ECMWF model. Yellow lines indicate individual ensemble-member
forecasts, with the green line showing the ensemble-mean. A measure of the model
“spread” is denoted by the gray shading. Sector numbers indicate the phase of the
MJO, with geographical labels indicating where anomalous convection occurs during
that phase. Image source: https://www.cpc.ncep.noaa.gov/products/precip/CWlink/MJO/CLIVAR/ecmf.shtml
Get Detailed Seasonal Weather Intelligence with sCast
We appreciate your taking the time to read the public Arctic Oscillation blog from Dr. Judah Cohen and the AER Seasonal Forecasting team.
Dr. Cohen’s detailed monthly seasonal forecast, sCast, is also available for purchase. sCast provides a monthly 30-60-90-180-day outlook into temperature and precipitation, solar flux and wind anomalies across the globe, and regional population weighted cooling and heating degree forecasts for the US.
Our sCast principal engineer, Karl Pfeiffer, can help you use sCast and other AER seasonal forecast products to deliver important, long-lead time weather intelligence to your business. Please reach out to Karl today!


 (click image to play)
