January 6, 2025
Dr. Judah Cohen from Atmospheric and Environmental Research (AER) embarked on
an experimental process of regular research, review, and analysis of the Arctic
Oscillation (AO) and Polar Vortex (PV). This analysis is intended to provide researchers
and practitioners real-time insights on one of North America’s and Europe’s leading
drivers for extreme and persistent temperature patterns.
During the winter schedule the blog is updated once every week. Snow accumulation
forecasts replace precipitation forecasts. Also, there is renewed emphasis on ice and
snow boundary conditions and their influence on hemispheric weather. In late Spring,
we transition to a spring/summer schedule, which is once every two weeks. Snow
accumulation forecasts will be replaced by precipitation forecasts. Also, there will be
less emphasis on ice and snow boundary conditions and their influence on hemispheric weather.
Subscribe to our email list or follow me on Twitter (@judah47) for notification of updates.
The AO/PV blog is partially supported by NSF grant AGS: 1657748
Summary
- The Arctic Oscillation (AO) is currently negative and is predicted to remain negative to neutral the next two weeks as pressure/geopotential height anomalies across the Arctic are currently mostly positive and are predicted to remain mostly positive to mixed over the next two weeks. The North Atlantic Oscillation (NAO) is currently negative with positive pressure/geopotential height anomalies across Greenland and the NAO is predicted to remain negative the next two weeks as pressure/geopotential height anomalies are predicted to remain mostly positive across Greenland.
- This week ridging/positive geopotential height anomalies across Greenland will support troughing/negative geopotential height anomalies across Northern Europe with ridging/positive geopotential height anomalies across Southern Europe. However next week the Greenland ridging will extend across much of Europe. This pattern will support mostly normal to above normal temperatures across Central and Southern Europe with normal to below normal temperatures across Northern Europe including the United Kingdom (UK) this week. Then next week temperatures will turn mostly normal to above normal across most of Europe including the UK.
- Ridging/positive geopotential height anomalies are predicted to dominate Asia the next two weeks with troughing/negative geopotential height anomalies across Northeast Asia this week and Northwest Asia next week. This pattern favors widespread normal to above normal temperatures across much of Asia, with regional normal to below normal temperatures across Eastern Siberia and Northeast Asia this week Northwest Russia next week.
- The general pattern across North America the next two weeks is ridging/positive geopotential height anomalies centered in Alaska, Western Canada and the Western United States (US) and Northeastern Canada supporting ridging/positive geopotential height anomalies across Eastern Canada and the Eastern US. Then during the third week of January the Alaskan ridging will shift to near the Aleutians allowing for more widespread troughing across North America. This pattern favors normal to above normal temperatures across Alaska and much of Canada with normal to above normal temperatures across the Eastern US. However, during the third week of January below normal temperatures will become more widespread across Alaska, Canada and the Northwestern US.
- This winter has been all about the polar vortex (PV) alternating between strong and a stretched PV. This pattern looks to continue but for how long? Also still watching the battle between high latitude blocking and a strong PV, which has been at a stalemate all winter long. Any signs of a winner?
Plain Language Summary
For the Chinese New Year we might have the year of the snake but for the weather it is definitely the winter of the stretched polar vortex (PV). One is currently underway (number five) and another is predicted for the third week of January (number six) and certainly more are possible. Stretched PVs typically bring cold weather to the North America and East Asia but this winter the cold air in North America has been more impressive (Figures 3 and 6). A Canadian warming from last month has spawned a Greenland high pressure that is delivering colder and snowier weather for Europe this week (Figure 3) but this will be short-lived. Can anything break this cycle of “lather, rinse repeat?” The models say yes but I am skeptical.
Impacts
The theme of this winter seems to be the stretched polar vortex (PV) and how the PV got on this ridiculous infinite loop of “lather, rinse repeat” I am not sure but the ride continues with the PV alternating between a stretched PV and a relaxation to a more circular shape. And just maybe the PV throws in a quick Canadian warming to show it isn’t just a one trick pony. Regardless the transition to different PV phases or modes at breakneck speed continues for the foreseeable future. The rapid transitions of the PV to different modes or phase can be seen in the latest PV animation in Figure i.
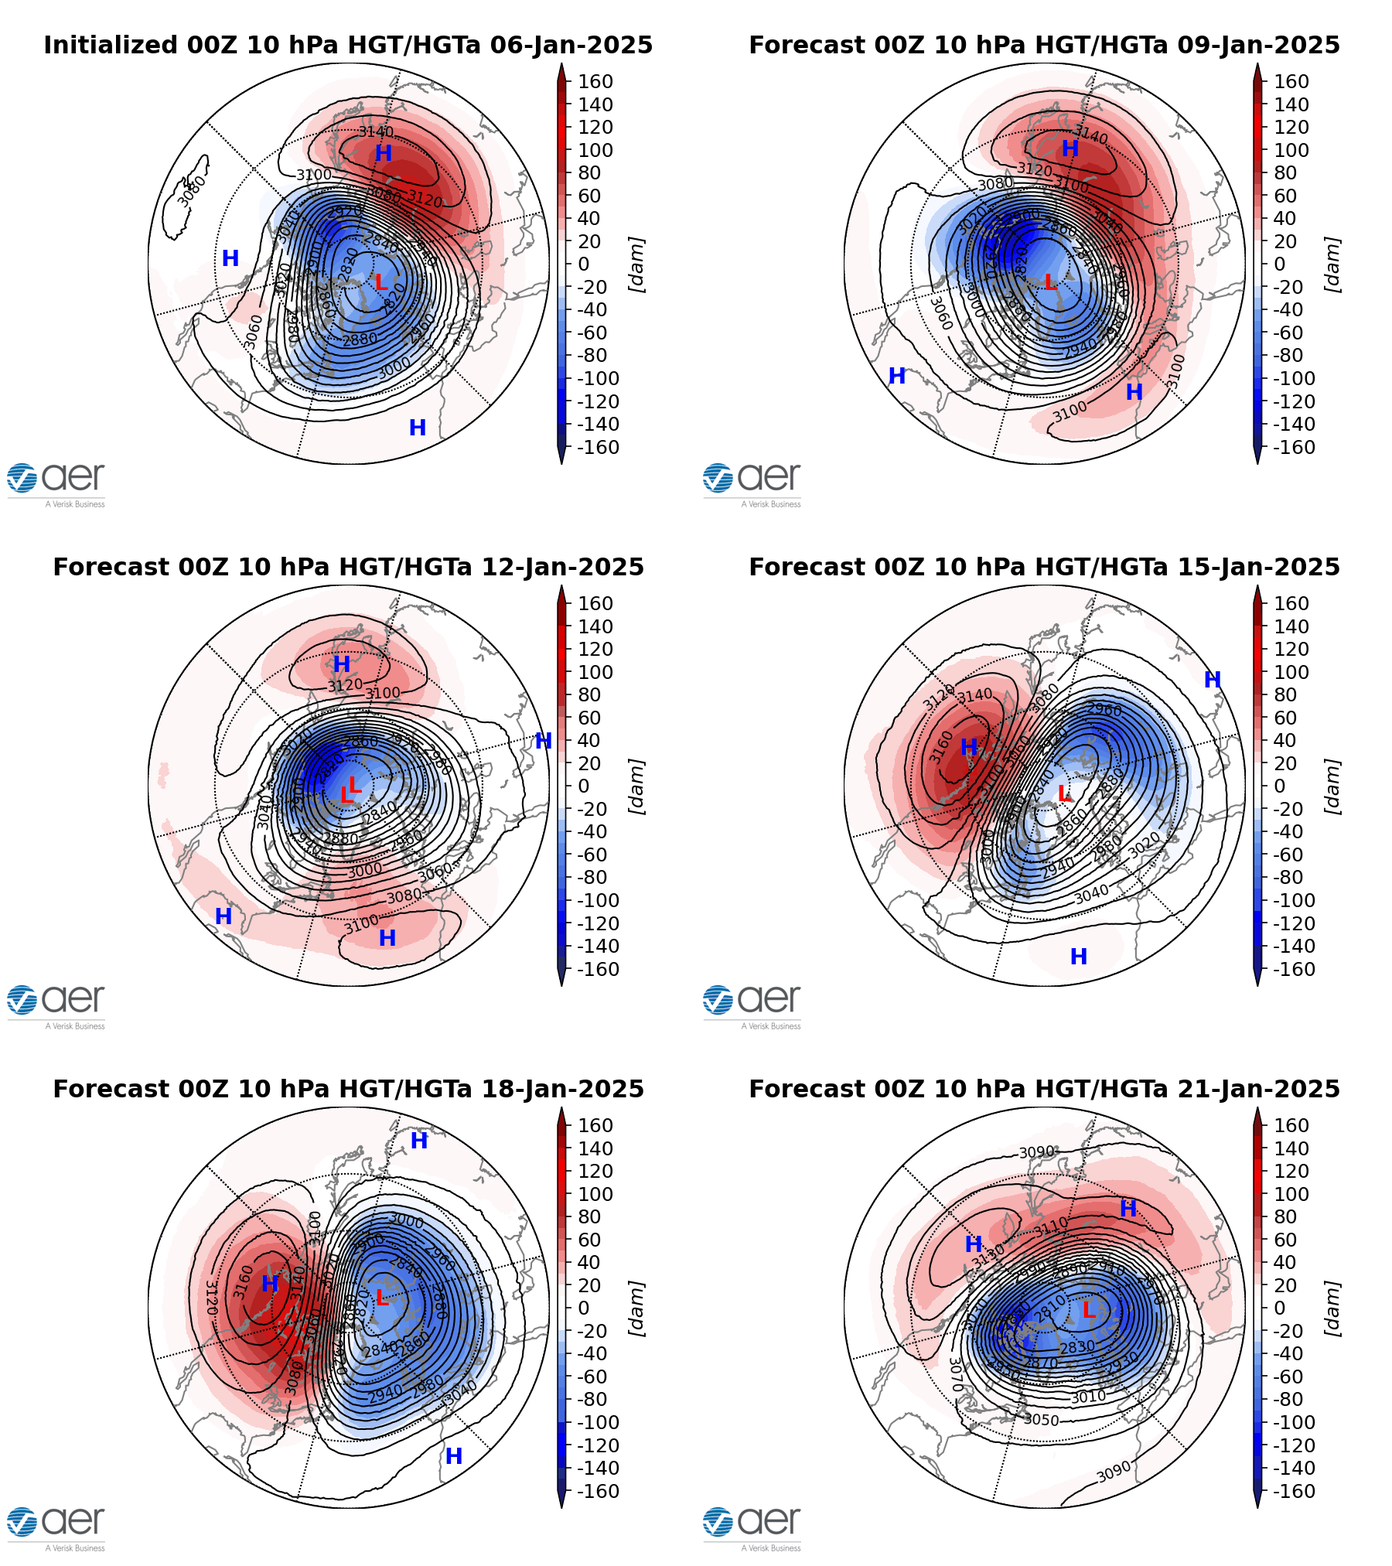
Figure i. Initialized 10 mb geopotential heights (dam; contours) and temperature anomalies (°C; shading) across the Northern Hemisphere for 06 January 2025 and forecasted from 06 January to 21 January 2025. The forecasts are from the 00Z 05 January 2025 GFS model ensemble.
The current stretched PV (fifth of the season has been by far the most impressive of the season. In last week’s blog I tried to show this with the wave reflection diagnostics and show it again in today’s blog. During wave reflection, wave energy goes up over Asia, bouncing off the stratospheric PV and then downward over North America. The downward wave energy amplifies the ridge-trough wave over North America and determines the strength or amplitude of the North American wave and the axis or position (see Figure ii). This wave reflection event is quite robust, and I do think that is contributing to the severity of the cold air outbreak predicted for the Eastern US this week. This is also likely helping to overcome some shortcomings with this stretched PV (as in producing extreme winter weather) including a lack of antecedent cold air in both Siberia and the North American Arctic, well below normal North American snow cover extent and a PV that is normal to strong. Also, remarkably the wave reflection is predicted to continue for two weeks! I really don’t recall such a long duration wave reflection event. I think this is why the PV stretch merry goround isn’t over just yet.
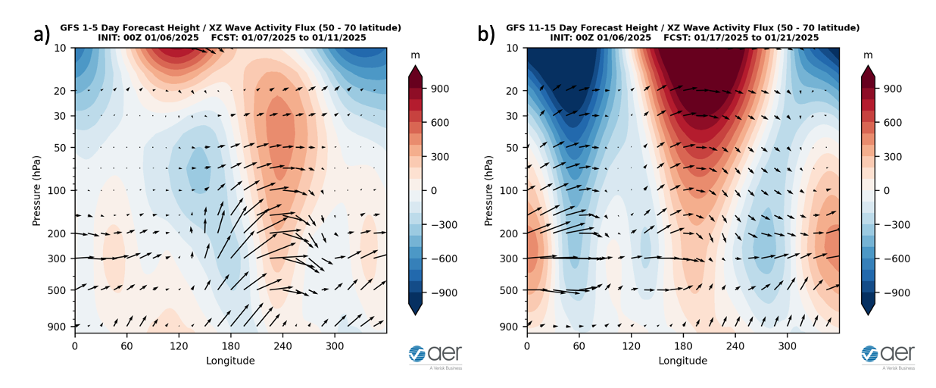
Figure ii. Longitude-height cross section of geopotential eddy height anomalies (shading) and wave activity flux (vectors) forecasted for a) 7 January through11 January 2025 and b) 17 January through 21 January 2025. The forecasts are from the 00Z 06 January 2025 GFS ensemble.
The resultant ridging with the wave reflection (arrows boomeranging off the Alaska ridging shown in orange shading) is around 120ºW and the resultant trough starting to take shape (blue shading where the arrows are pointed downward) is around 60ºW (see Figure iia). Interestingly the GFS is predicting that the wave reflection will shift westwards with time so that during the third week of January the ridging shown in orange shading is now around 150ºW and the more mature trough (blue shading where the arrows are pointed downward) is around 80ºW (see Figure iib). I think that this westward shift in the wave reflection explains why the GFS is predicting the cold air to become increasingly focused further to the west as January progresses (see Figures 3 and 9).
The energy diagnostics in Figure ii are very volatile and can change from day to day so caution is needed when using them to forecast but this upcoming forecast of wave reflection has been unusually consistent. Stretched PVs are not only associated with extreme cold but also snowstorms and one snowstorm is ongoing today in the Eastern US and another is possible over the weekend but so far, I have not been invited to the snow party.
Stretched PVs deliver severe winter weather not only to North America but also East Asia. This event is clearly more impressive in North America than East Asia but seems no one told Japan as the record snowfall keeps going.
The Canadian warming from the end of December did spawn blocking high pressure over Northeastern Canada and Greenland. The resultant Greenland high pressure has resulted in colder weather across Northern Europe and even snowfall. I have seen the tweets of snow in England, Ireland and I assume Scotland as well. But the high pressure is predicted to expand towards Europe (see Figure iii). This will likely result in the cold weather for Europe to be short lived. Interestingly the models do predict the Greenland blocking to return at the end of the forecasts (see Figure iii). So colder weather could return to Europe in the second half of January as it is predicted for the US.
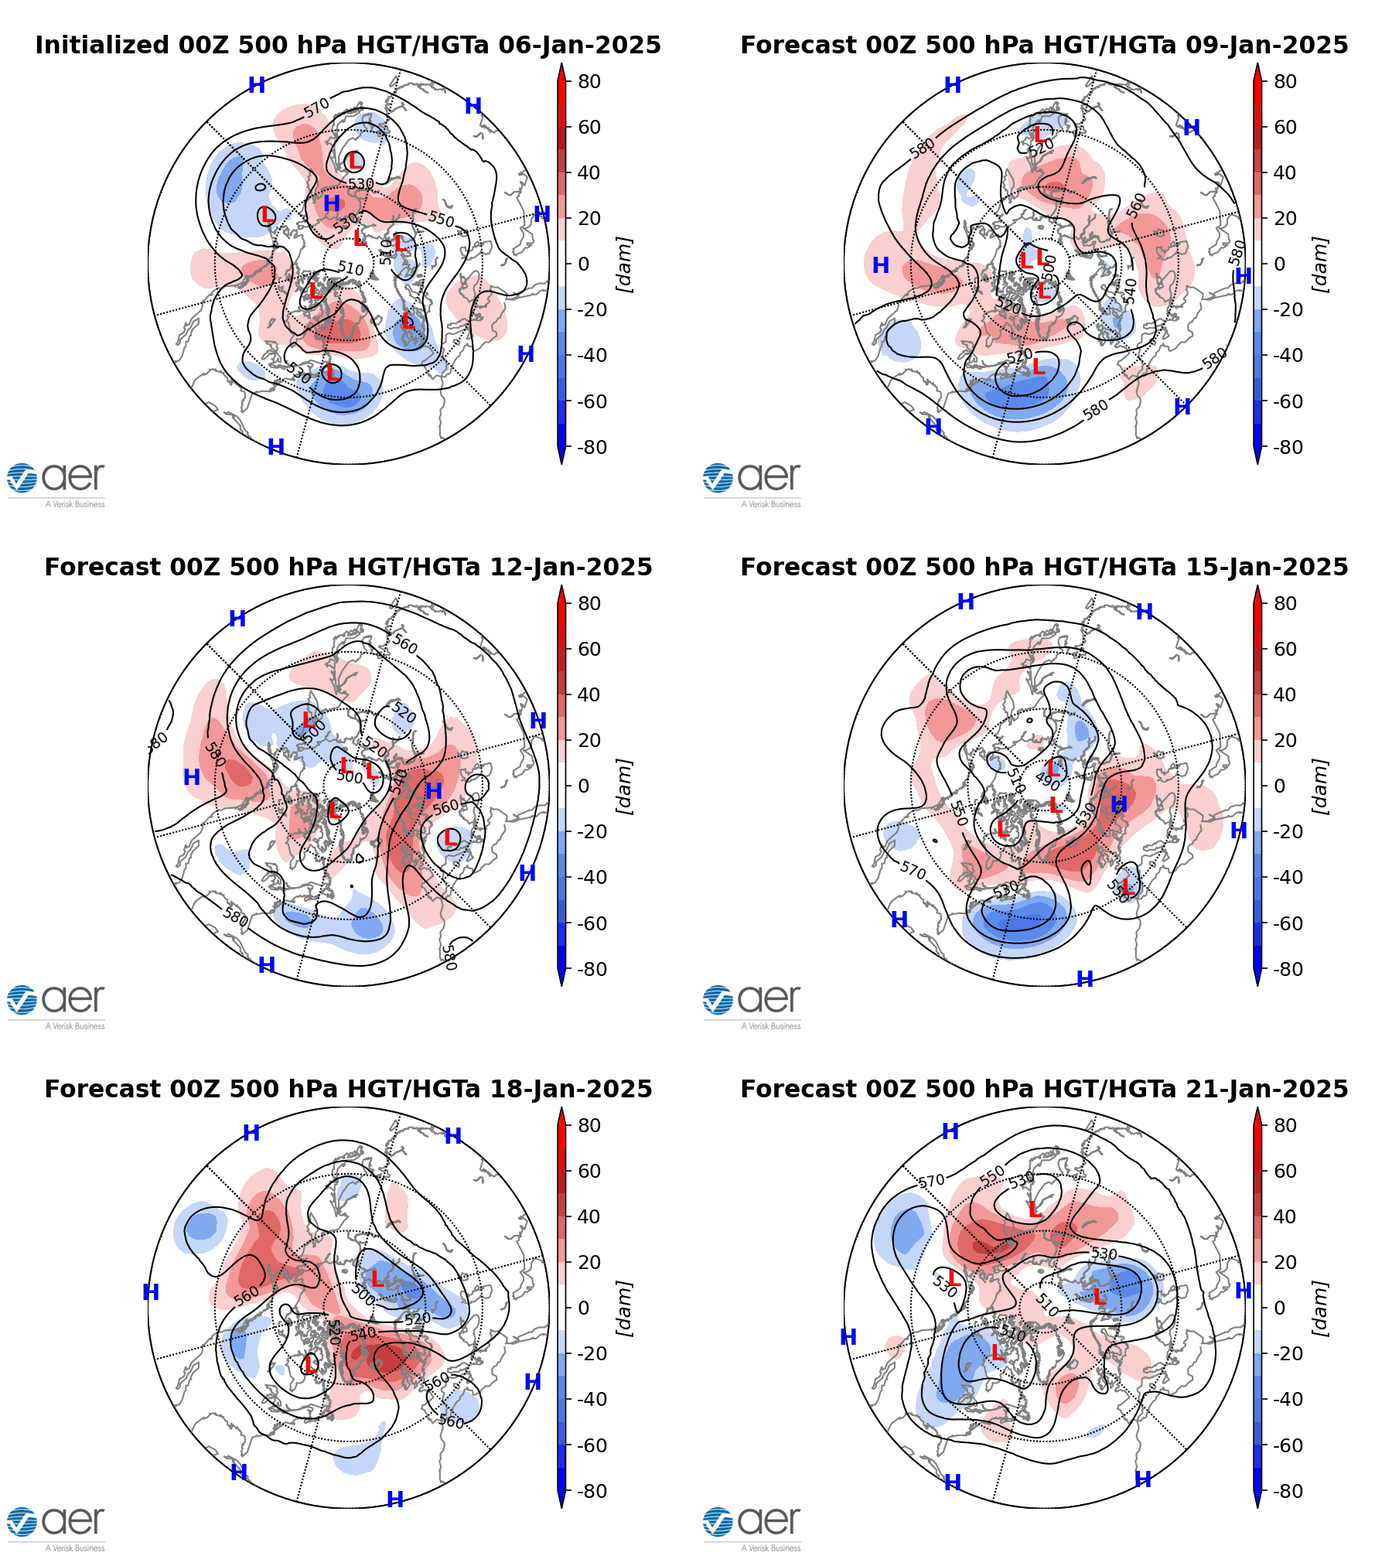
Figure iii. Initialized 500 mb geopotential heights (dam; contours) and decameter anomalies (dam; shading) across the Northern Hemisphere for 06 January 2025 and forecasted from 06 January to 21 January 2025. The forecasts are from the 00Z 06 January 2025 GFS model ensemble.
All the models are predicting another stretched PV starting in the second half of January (sixth of the winter). This should help to build cold air in Alaska and Western Canada, and this is showing up in all the weather models (see Figure 9). One thing that is very curious to me is that the models are predicting the next stretched PV to be in two parts with one on January 15th and 16th and another at the end of the run on January 20th and 21st with a quasi-Canadian warming in between the two PV stretches (see Figure i). The models look less impressive with the Canadian warming in their latest runs, and I am not really sure what to make of it. I think this might be best considered as one PV stretched event, but it might come in two separate pieces. Maybe its impact on the weather is that the cold entering the US comes in pieces rather in just one fell swoop.
The other curiosity is where the cold is focused in the US, the Western US or the Eastern US. The GFS has been consistently the furthest west with the cold. You can see that the stretched PV in Figure i is directed at the Western US (very last frame) and based on the wave reflection we can understand why the GFS is becoming more westward shifted in its cold forecast. The Canadian and European models have been more skittish but overall have been focused more in the Eastern US. In the latest European operational forecast of the polar vortex, the stretched PV is directed at the Eastern US and not the Western US in contrast to the GFS. Based on the orientation of the ensemble PV forecasts (see Figure 13b) I am inclined to side with the model forecasts that are more eastward shifted and not with the more westward shifted GFS forecasts.
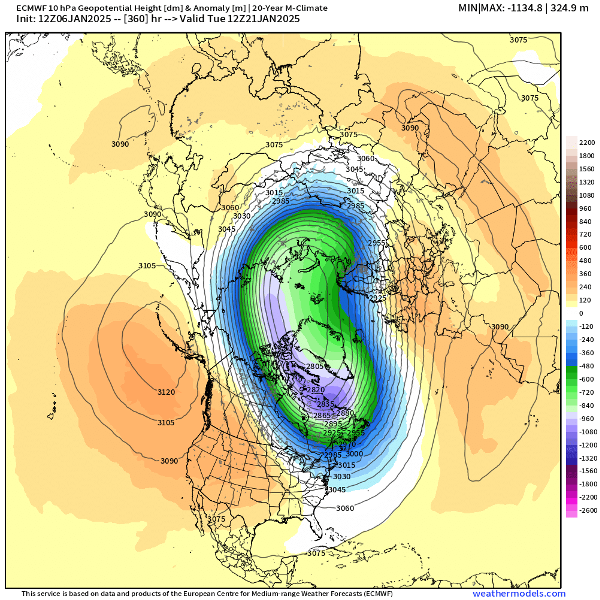
Figure iv. Forecasted 10 mb geopotential heights (dam; contours) and anomalies (meters; shading) across the Northern Hemisphere for 21 January 2025. The forecasts are from the 00Z 06b January 2025 ECMWF operational model. Plot taken from https://weathermodels.com.
So far, no signs of a weakening PV so the stretched PV for week three and possibly four of January should quickly wind down allowing for a relaxation of the cold pattern or even allowing for a mild pattern. But the stretched PVs have been happening in such short frequency there is hardly time to notice the warm-up. Will that continue hard to know but I see no convincing signs we are getting off this merry go-round just yet.
I think the best way to break this cycle is to either have a strong and durable Ural-Scandinavian block coupled with deep downstream troughing across Northeast Asia and out into the North Pacific that would lead to a larger disruption of the PV. But so far, no model is predicting this. Instead, the models are predicting Ural troughing and Siberian ridging (see Figure 8) and this should help to strengthen the PV even further and potentially reduce the possibility of further PV stretches. Something definitely to watch but the models have been pretty awful with their forecasts beyond a week of high latitude blocking this winter, so for now I am skeptical.
Near-Term
This week
The AO is predicted to be mostly negative this week (Figure 1) with mostly positive geopotential height anomalies across the Arctic and with mixed geopotential height anomalies across the mid-latitudes of the NH (Figure 2). With predicted positive geopotential height anomalies across Greenland (Figure 2), the NAO is predicted to be negative this week as well.


Figure 1. a) The predicted daily-mean AO at 10 hPa from the 00Z 06 January 2025 GFS ensemble. b) The predicted daily-mean AO at 1000 hPa from the 00Z 06 January 2025 GFS ensemble. Gray lines indicate the AO index from each individual ensemble member, with the ensemble mean AO index given by the red line with squares.
This week, ridging/positive troughing/negative geopotential height anomalies across Greenland will support troughing/negative geopotential height anomalies across Northern Europe with ridging/positive geopotential height anomalies across Southern Europe (Figures 2). This pattern will favor normal to above normal temperatures across Central and Southern Europe with normal to below normal temperatures across Northern Europe including the UK this period (Figure 3). This week the predicted pattern across Asia is widespread ridging/positive geopotential height anomalies with troughing/negative geopotential height anomalies mostly confined to Far Eastern Siberia and Northeastern Asia (Figure 2). This pattern favors normal to above normal temperatures widespread across much of Asia with normal to below normal temperatures limited to Eastern Siberia and Northeast Asia (Figure 3).
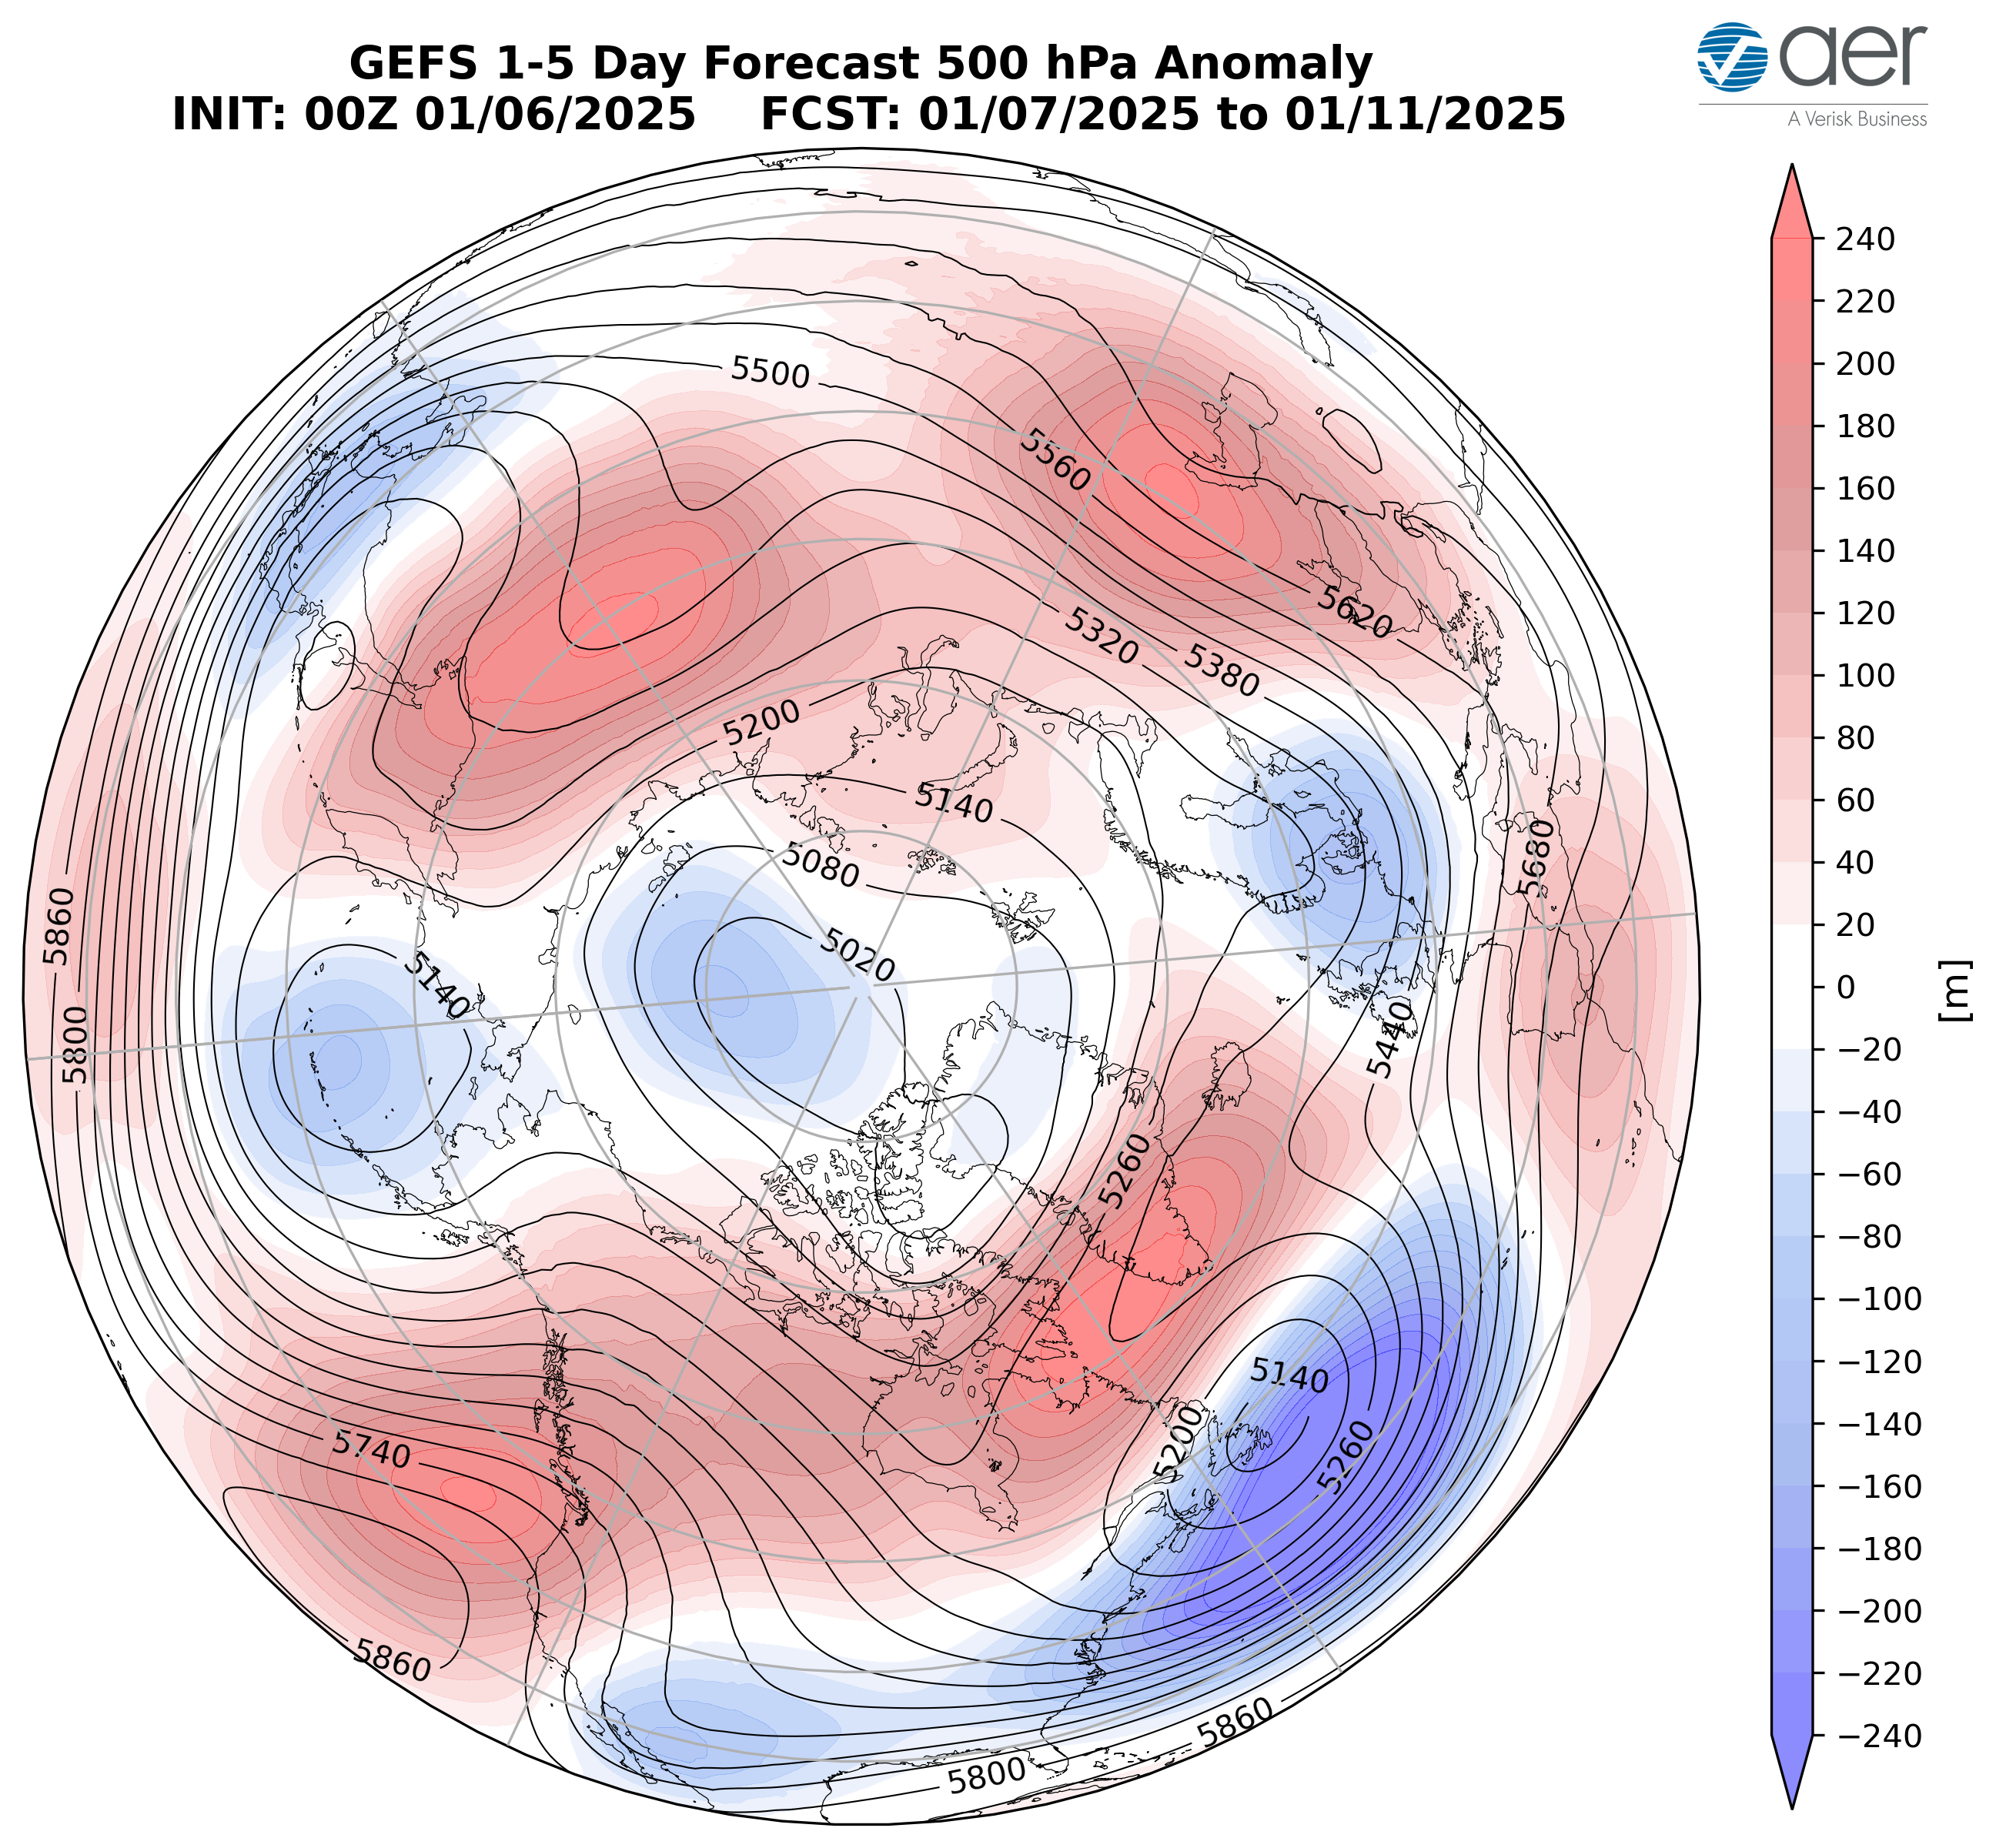
Figure 2. Forecasted average 500 mb geopotential heights (dam; contours) and geopotential height anomalies (m; shading) across the Northern Hemisphere from 07 Jan to 11 Jan 2025. The forecasts are from the 00Z 06 January 2025 GFS ensemble.
This week ridging/positive geopotential height anomalies across Alaska, Western and Northeastern Canada and the Western US will support troughing/negative geopotential height anomalies across Southern and Eastern Canada and the Eastern US. (Figure 2). This pattern favors normal to above normal temperatures across Alaska, much of Canada and the Western US with normal to below normal temperatures across Ontario, the Central and Eastern US (Figure 3).

Figure 3. Forecasted surface temperature anomalies (°C; shading) from 06 Jan to 10 Jan 2025. The forecast is from the 00Z 05 January 2025 GFS ensemble.
Troughing and/or cold temperatures will support new snowfall in Scandinavia, part so Siberia, Central and Northeast Asia while warm temperatures will support snowmelt in Western Russia this week (Figure 4). Troughing and/or cold temperatures will support new snowfall across Alaska, Northern and Eastern Canada, the higher elevations of the Canadian West Coast, the Southeastern US and New England while warm temperatures will support snowmelt in Western Canada and the Western US this week (Figure 4).

Figure 4. Forecasted snow depth changes (mm/day; shading) from 07 Jan to 11 Jan 2025. The forecast is from the 00Z 06 January 2025 GFS ensemble.
With geopotential height anomalies remaining mostly positive across the Arctic and with mixed geopotential height anomalies across the mid-latitudes this period (Figure 5), the AO will likely be negative to neutral this period (Figure 1). With predicted mostly positive pressure/geopotential height anomalies across Greenland (Figure 5), the NAO will likely be negative this period.
Forecasted snow depth changes (mm/day; shading) from 06 Jan 2025 to 10 Jan 2025. The forecast is from the 00Z 05 January 2025 GFS ensemble.
Near-Mid Term
Next week
With geopotential height anomalies remaining mostly positive across the Arctic and with mixed geopotential height anomalies across the mid-latitudes this period (Figure 5), the AO will likely be near negative this period (Figure 1). With predicted positive pressure/geopotential height anomalies across Greenland (Figure 5), the NAO will likely be negative this period.
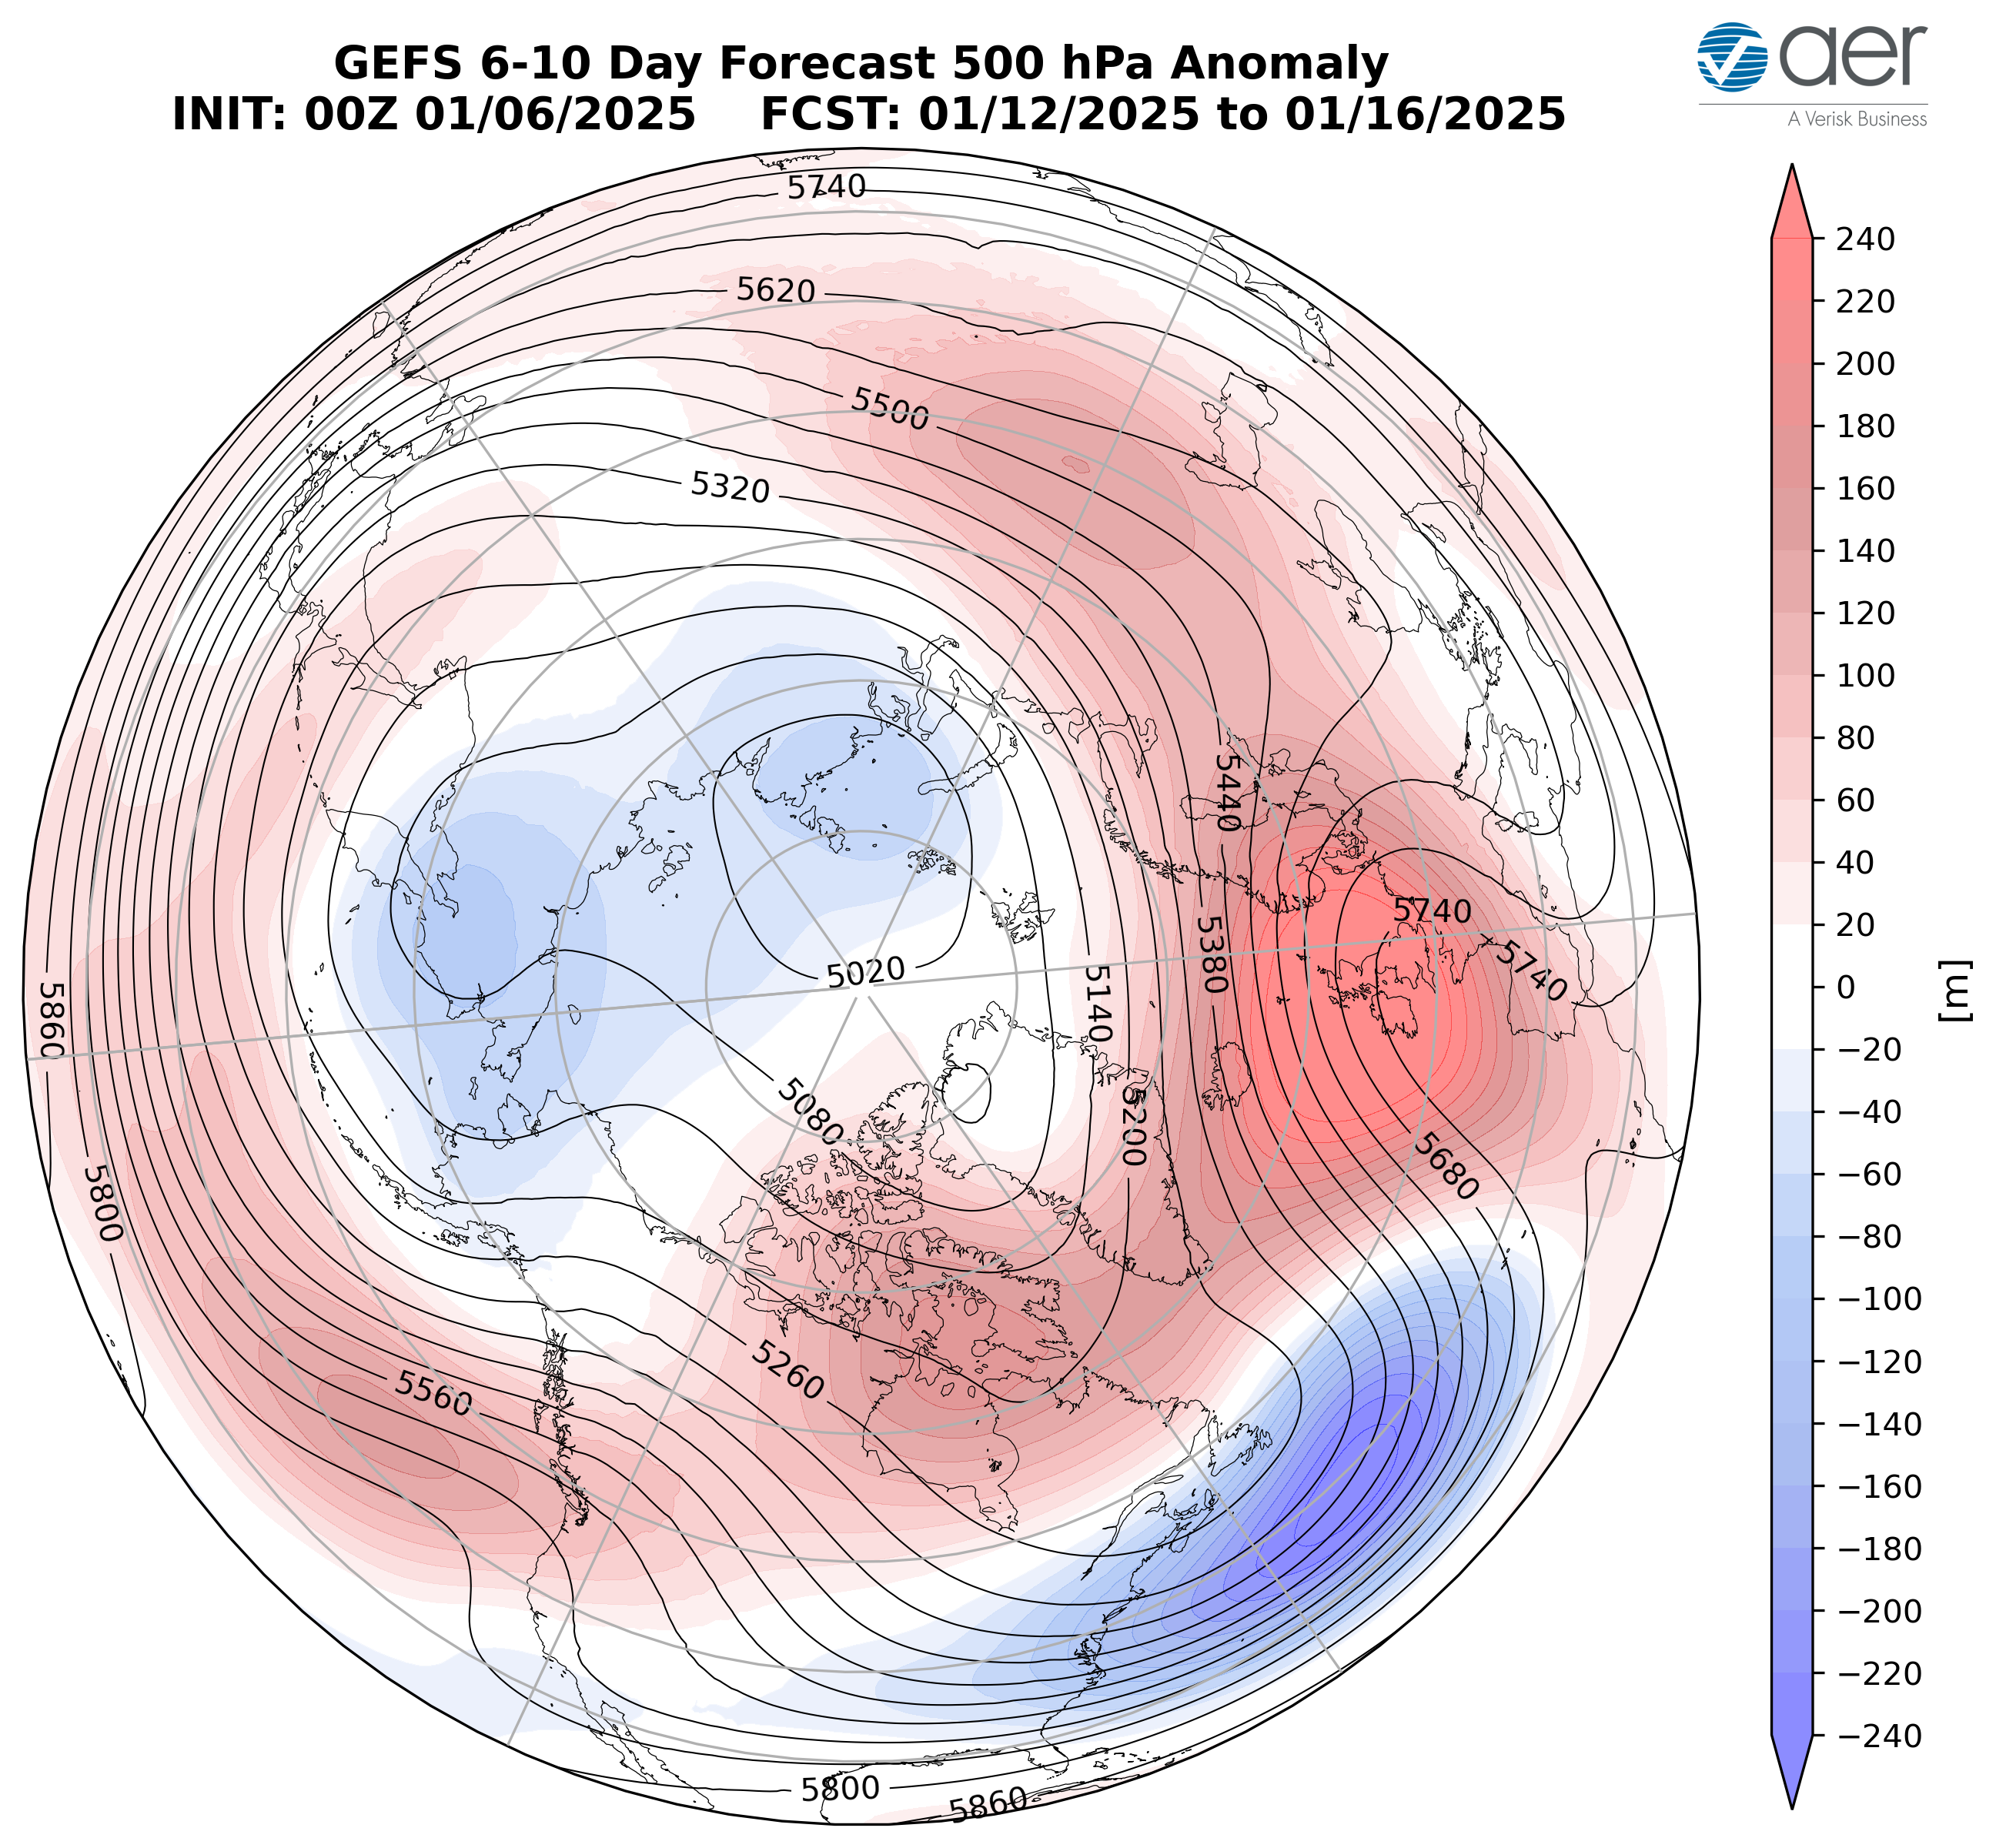
Figure 5. Forecasted average 500 mb geopotential heights (dam; contours) and geopotential height anomalies (m; shading) across the Northern Hemisphere from 12 Jan to 16 Jan 2025. The forecasts are from the 00Z 06 January 2025 GFS ensemble.
Ridging/positive geopotential height anomalies Previously centered across Greenland wil slide east and start to overspread much of Europe with the exception of troughing/negative geopotential height anomalies in the western Mediterranean this period (Figure 5). This pattern favors normal to above normal temperatures across much of Europe including the UK with normal to below normal temperatures in France and Spain under northerly this period (Figure 6). Once again ridging/positive geopotential height anomalies are predicted to dominate Asia with troughing/negative geopotential height anomalies limited to across Northern Siberia (Figure 5). This pattern favors widespread normal to above normal temperatures across Asia with normal to below normal temperatures mostly limited to Eastern Siberia this period (Figure 6).

Figure 6. Forecasted surface temperature anomalies (°C; shading) from 12 Jan to 16 Jan 2025. The forecast is from the 00Z 06 January 2025 GFS ensemble.
The amplified pattern is predicted to continue across North America with ridging/positive geopotential height anomalies predicted across Alaska, Western and Northeastern Canada and the Western US with troughing/negative geopotential height anomalies mostly limited to the Central and Eastern US this period (Figure 5). This pattern will favor widespread normal to above normal temperatures across Alaska, much of Canada and the Western US with normal to below normal temperatures mostly limited to the Central and Eastern US (Figure 6).

Figure 7. Forecasted snow depth changes (mm/day; shading) from 12 Jan to 16 Jan 2025. The forecast is from the 00Z 06 January 2025 GFS ensemble..
Troughing and/or cold temperatures will support new snowfall across Siberia while warm temperatures will support snowmelt in parts of Scandinavia, Northwestern Russia and the Alps this period (Figure 7). Troughing and/or cold temperatures will support new snowfall across southern and eastern Alaska, the West Coast mountains of Canada, Northern and Eastern Canada and the US Great Lakes while warm temperatures will support snowmelt in Southwestern Canada and the Western, Central and Southern US this period (Figure 7).
Mid Term
Week Two
With predicted persistent positive to mixed geopotential height anomalies across the Arctic and mixed geopotential height anomalies across the mid-latitudes this period (Figure 8), the AO will likely remain negative to neutral this period (Figure 1). With predicted persistent positive pressure/geopotential height anomalies across Greenland (Figure 8), the NAO will likely remain negative this period.
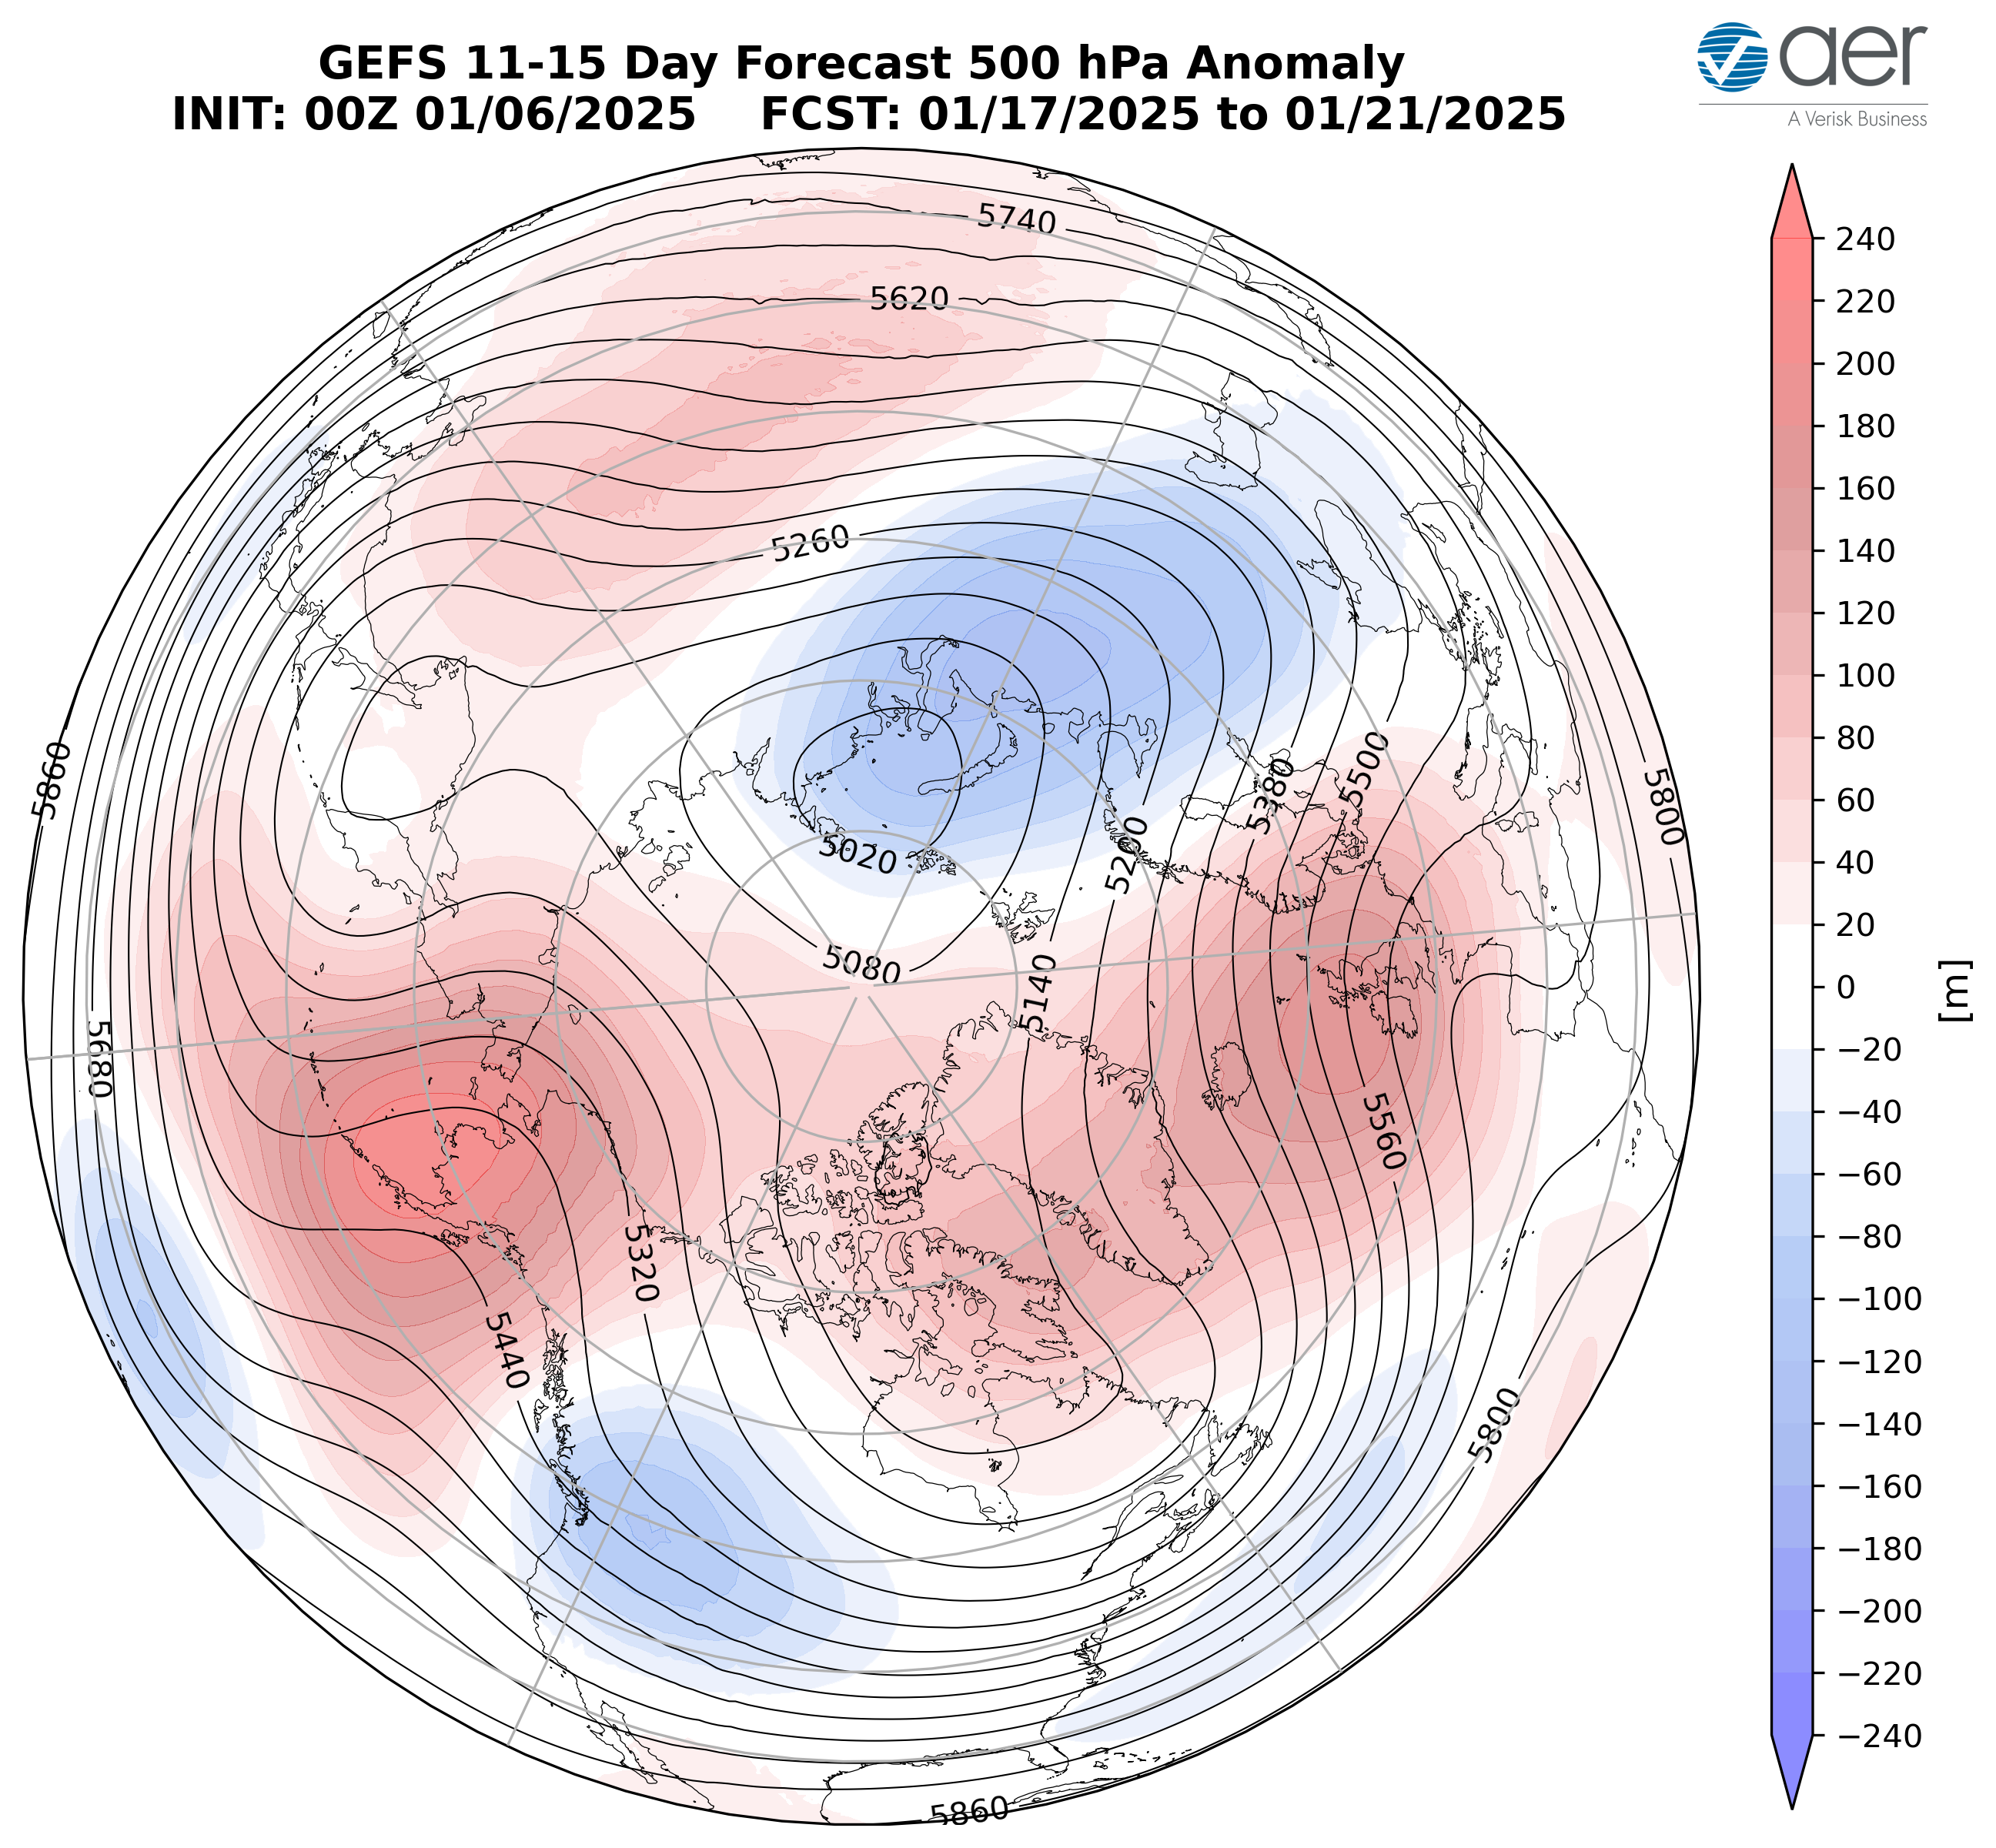
Figure 8. Forecasted average 500 mb geopotential heights (dam; contours) and geopotential height anomalies (m; shading) across the Northern Hemisphere from 17 Jan to 21 Jan 2025. The forecasts are from the 00Z 06 January 2025 GFS ensemble.
Persistent ridging/positive geopotential height anomalies across Greenland is predicted to continue expanding east across Europe with some weak troughing/negative geopotential height anomalies across the Mediterranean (Figure 8). This pattern should favor widespread normal to above normal temperatures across much of Europe this period (Figures 9). The persistent ridging/positive geopotential height anomalies across Greenland is predicted force troughing/negative geopotential height anomalies across Northern and now Western Asia with ridging/positive geopotential height anomalies across Southern Asia centered on Central Asia this period (Figure 8). The predicted pattern favors widespread normal to above normal temperatures across much of Asia with normal to below normal temperatures expanding across Northwestern Asia this period (Figure 9).

Figure 9. Forecasted surface temperature anomalies (°C; shading) from 17 Jan to 21 Jan 2025. The forecast is from the 00Z 06 Jan 2025 GFS ensemble.
Ridging/positive geopotential height anomalies are predicted to persist across Alaska and the Gulf of Alaska Western da supporting troughing/negative geopotential height anomalies across Western Canada and the Western US this period (Figure 8). Below normal temperatures will once again spread south and east out of Alaska into Western Canada and the Northwestern US with normal to above normal temperatures persisting across Eastern Canada and the Southern and Northeastern US this period (Figure 9).

Figure 10. Forecasted snow depth changes (mm/day; shading) from 17 Jan to 21 Jan 2025. The forecast is from the 00Z 06 Jan 2025 GFS ensemble.
Troughing and/or cold temperatures will support new snowfall across Scandinavia, the Alps, the Baltic region, the Caucuses, Western Russia, the Tibetan Plateaus and Northeastern Asia while warm temperatures will support snowmelt in Kazakhstan this period (Figure 10). Troughing and/or cold temperatures will support new snowfall across the West Coast mountains of Canada, Southern and Eastern Canada and the Northwestern US while warm temperatures will support snowmelt in Southeastern Alaska and the US Tennessee and Ohio Valleys this period (Figure 10).
Longer Term
30–day
The latest plot of the polar cap geopotential height anomalies (PCHs) currently shows warm/positive PCHs in the troposphere with cold/negative PCHs in the stratosphere (Figure 11). The cold/negative PCHs from the stratosphere are predicted to persist the next two weeks while the warm/positive PCHs in the troposphere are predicted to persist at varying strength. The contrast between cold/negative PCHs in the stratosphere and warm/positive PCHs in the troposphere continues for yet another two weeks (Figure 11). For now, this suggests that the stratosphere and troposphere are mostly uncoupled. While it did look like a weakening PV was becoming more likely last week, that is no longer the case.
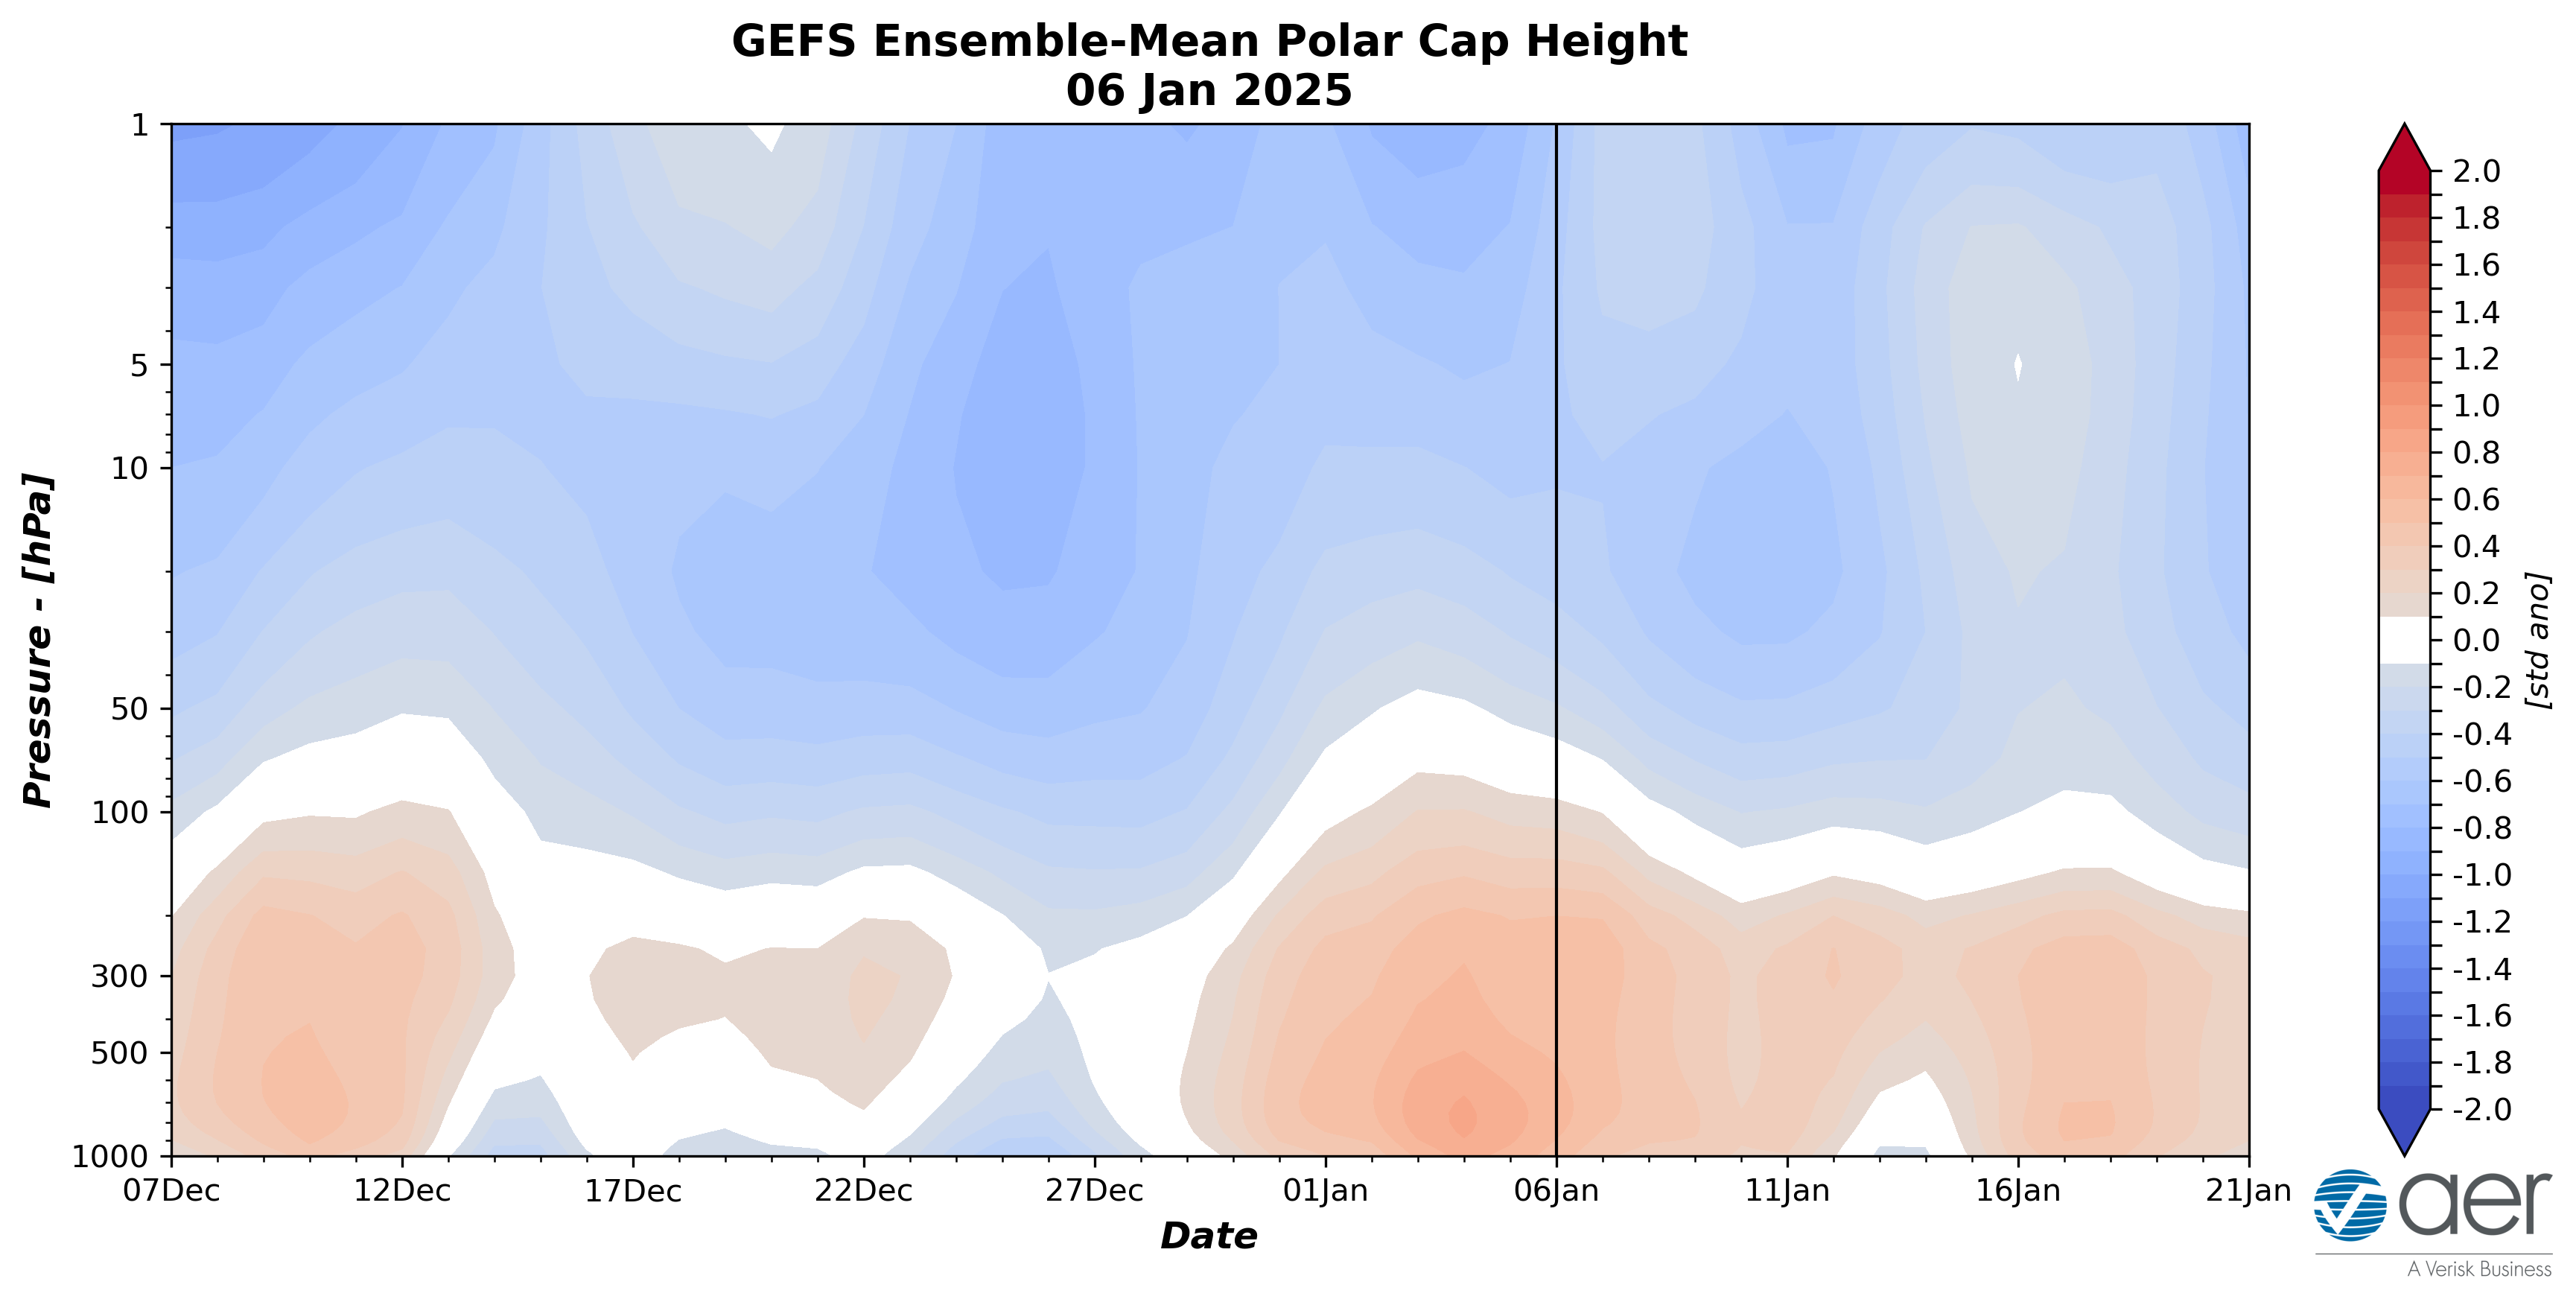
Figure 11. Observed and predicted daily polar cap height (i.e., area-averaged geopotential heights poleward of 60°N) standardized anomalies. The forecast is from the 00Z 06 Jan 2025 GFS ensemble.
The predicted warm/positive PCHs in the lower troposphere the next two weeks (Figure 11) are consistent with the predicted negative to neutral surface AO this week and next week (Figure 1). Still waiting to see if the warm/positive PCHs in the troposphere could force a larger polar vortex disruption. Still, lots of questions and no definitive signs.
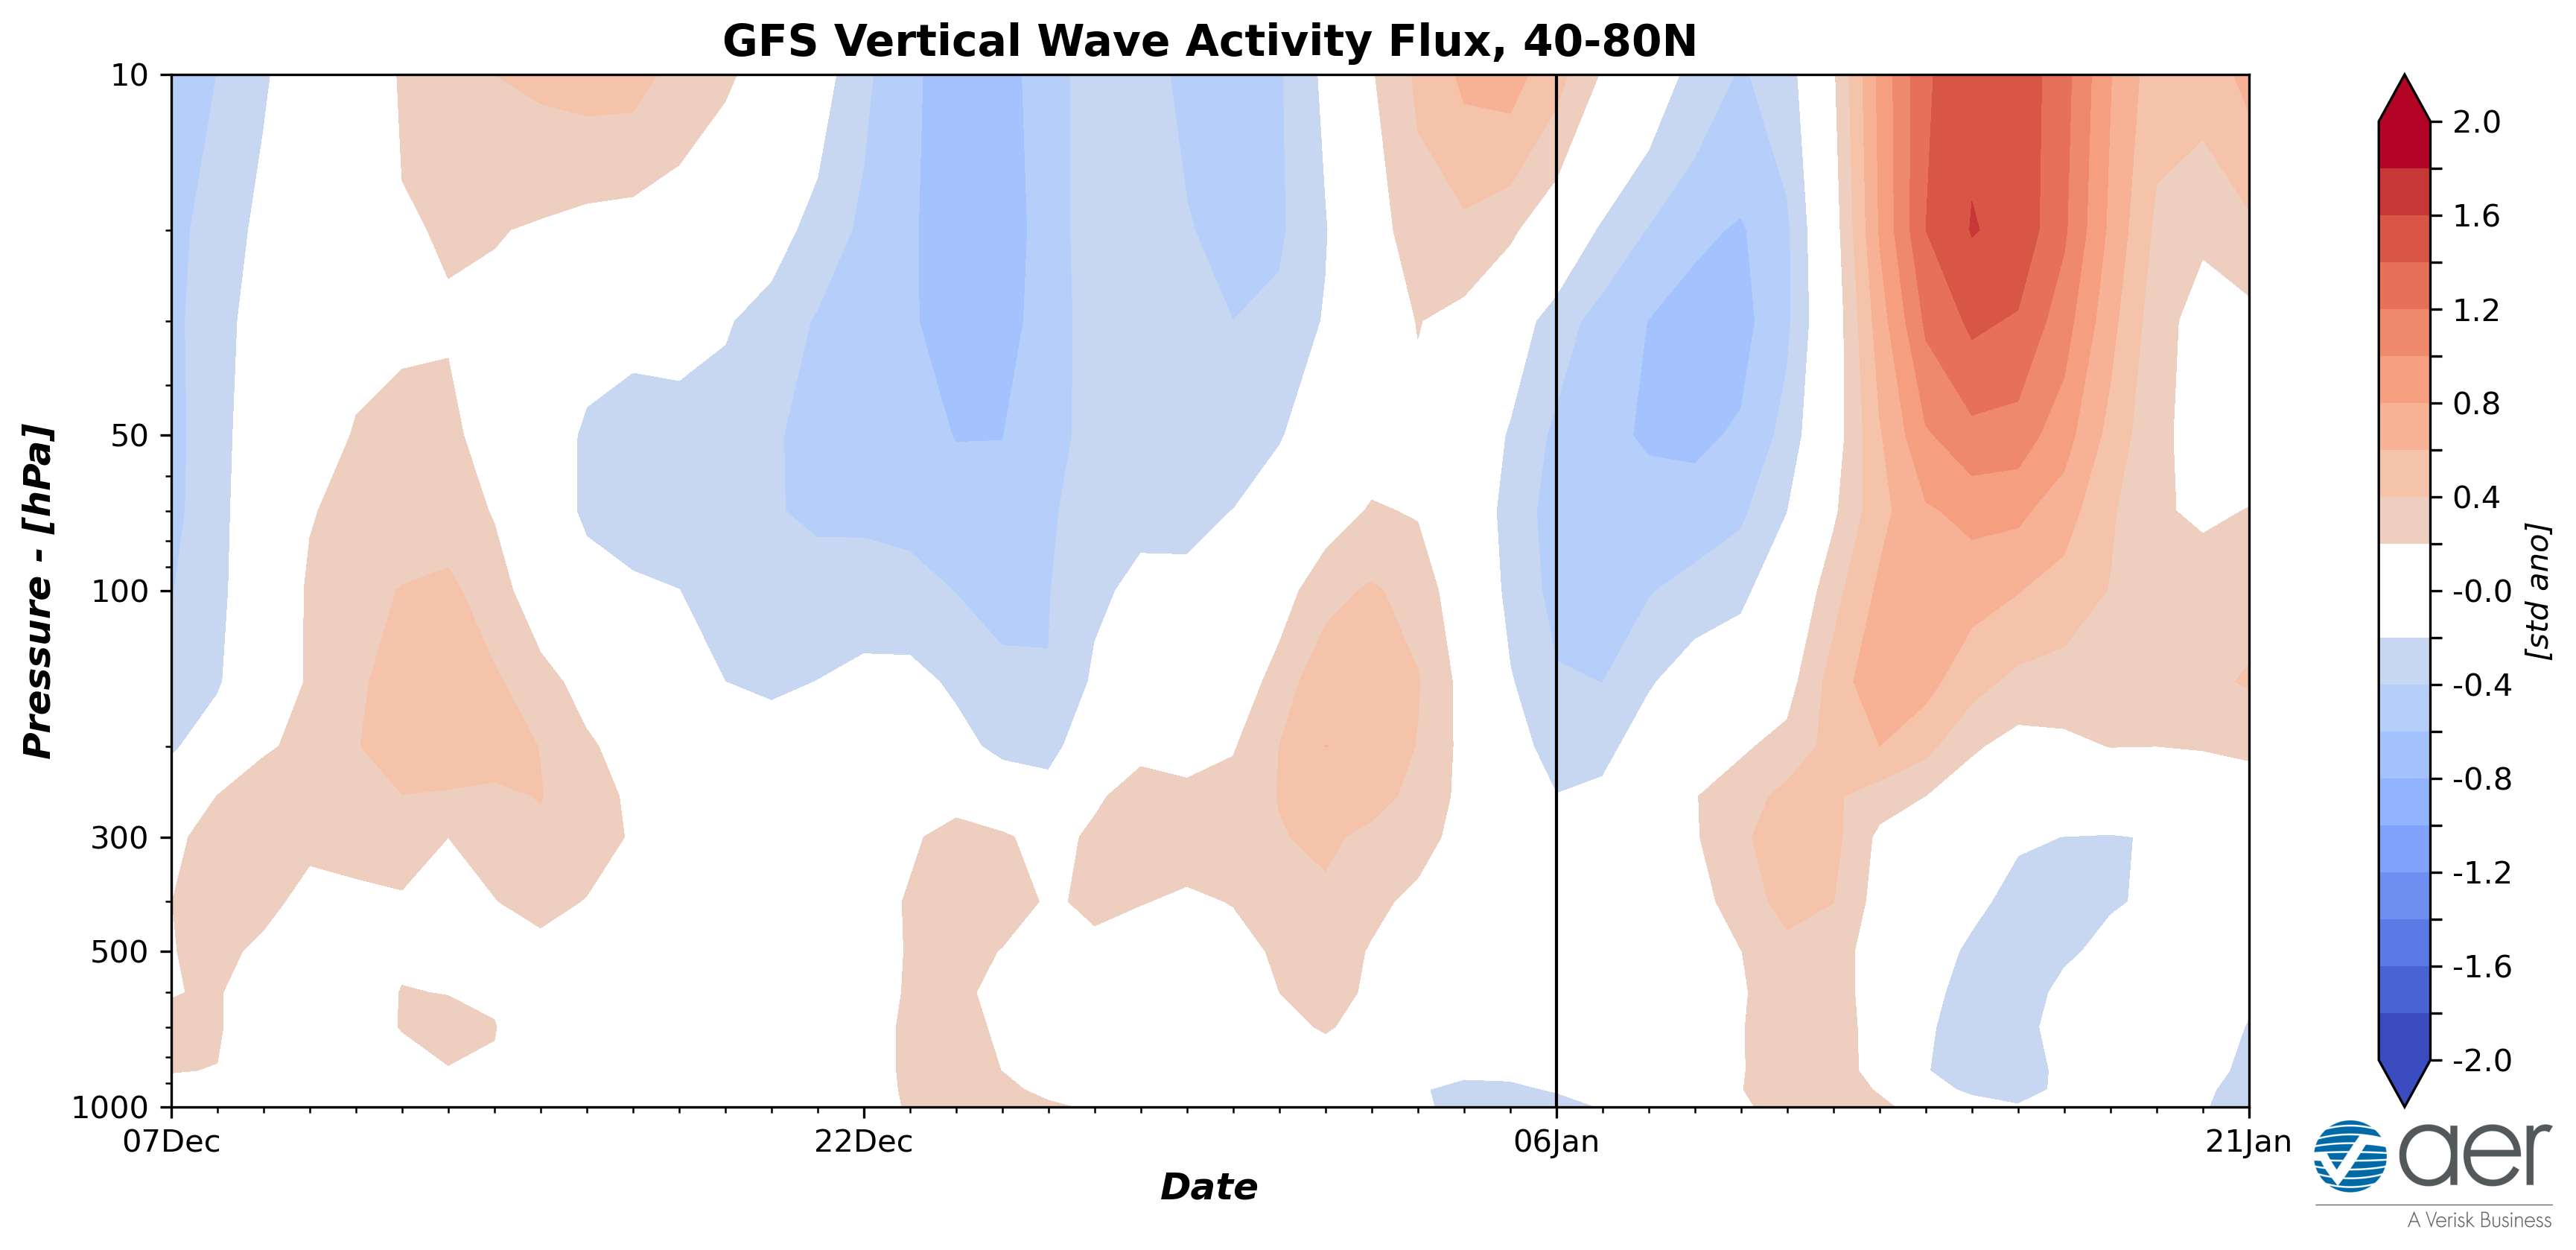
Figure 12. Observed and predicted daily vertical component of the wave activity flux (WAFz) standardized anomalies, averaged poleward of 40-80°N. The forecast is from the 00Z 06 Jan 2025 GFS ensemble.
Vertical Wave Activity Flux (WAFz) from the troposphere to the stratosphere or poleward heat transport in the stratosphere has been relatively quiet this season (Figure 12). However, the alternating positive (red) and negative (blue) WAFz anomalies is characteristic of wave reflection associated with stretched PVs (Figure 12). What is unusual is the rapidity of the changes. The alternating anomalies of WAFz are predicted to continue the first half of January, signaling to me, at least one more stretched PV for the second half of January.
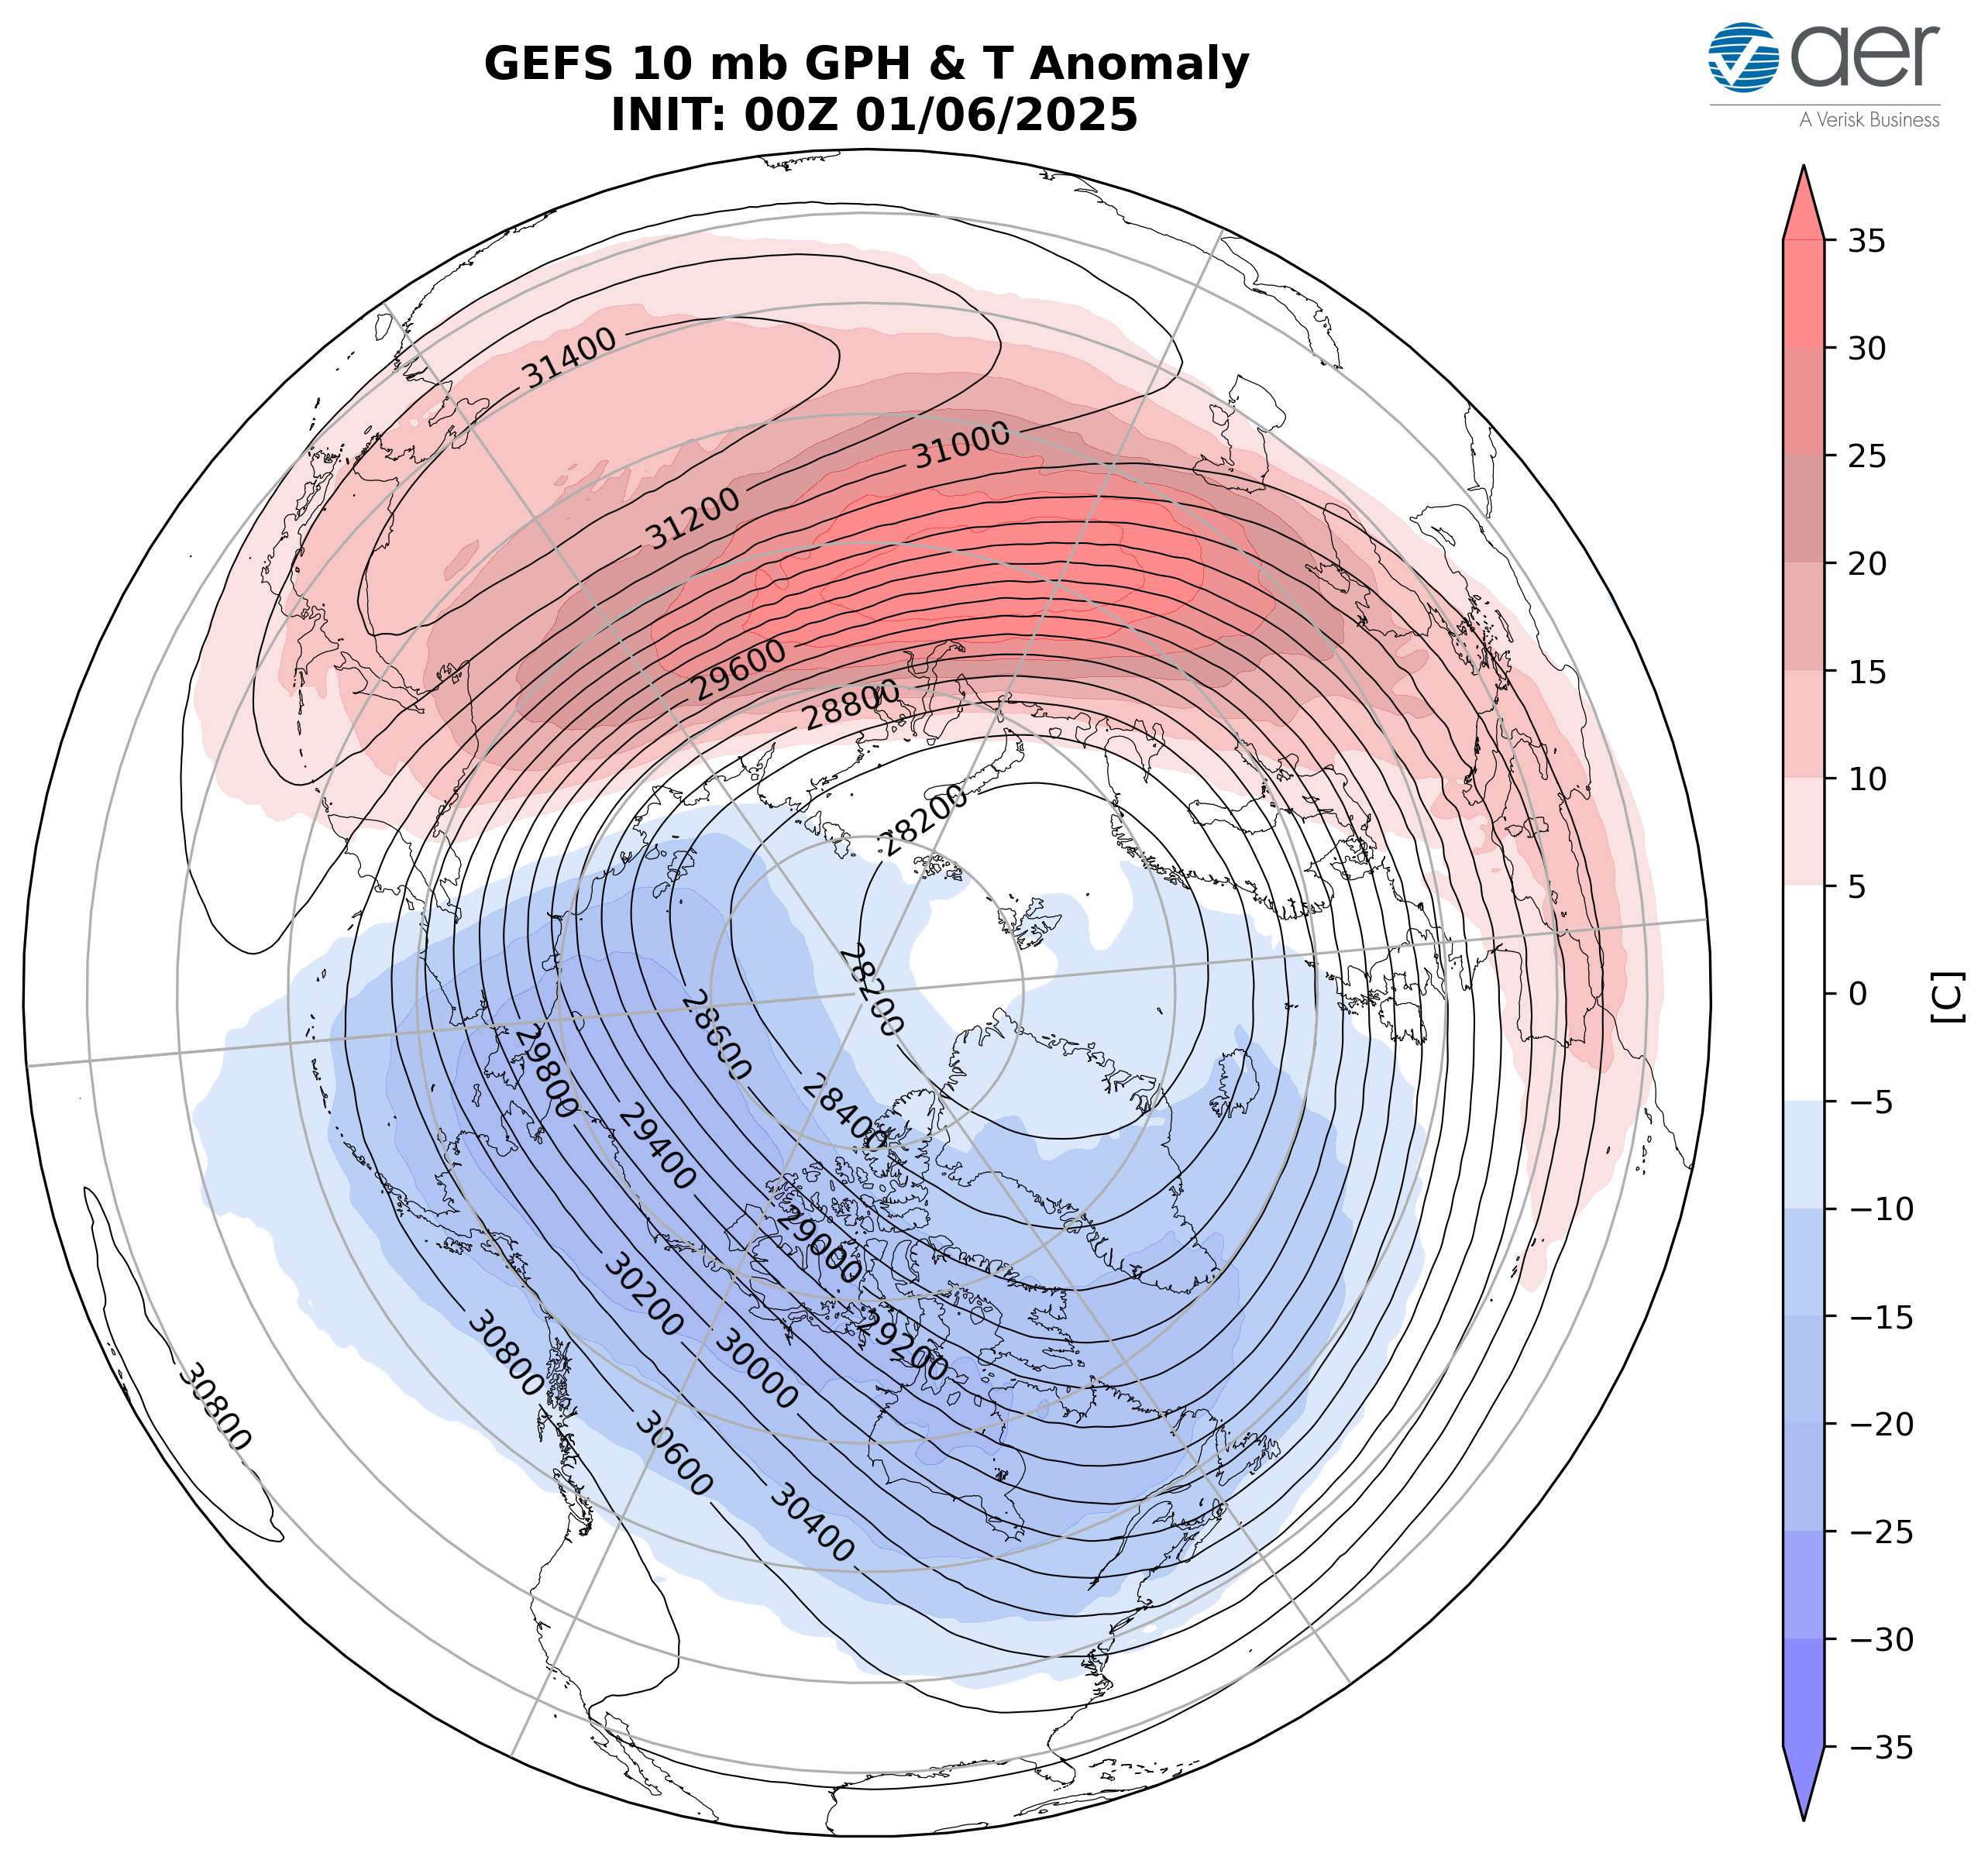
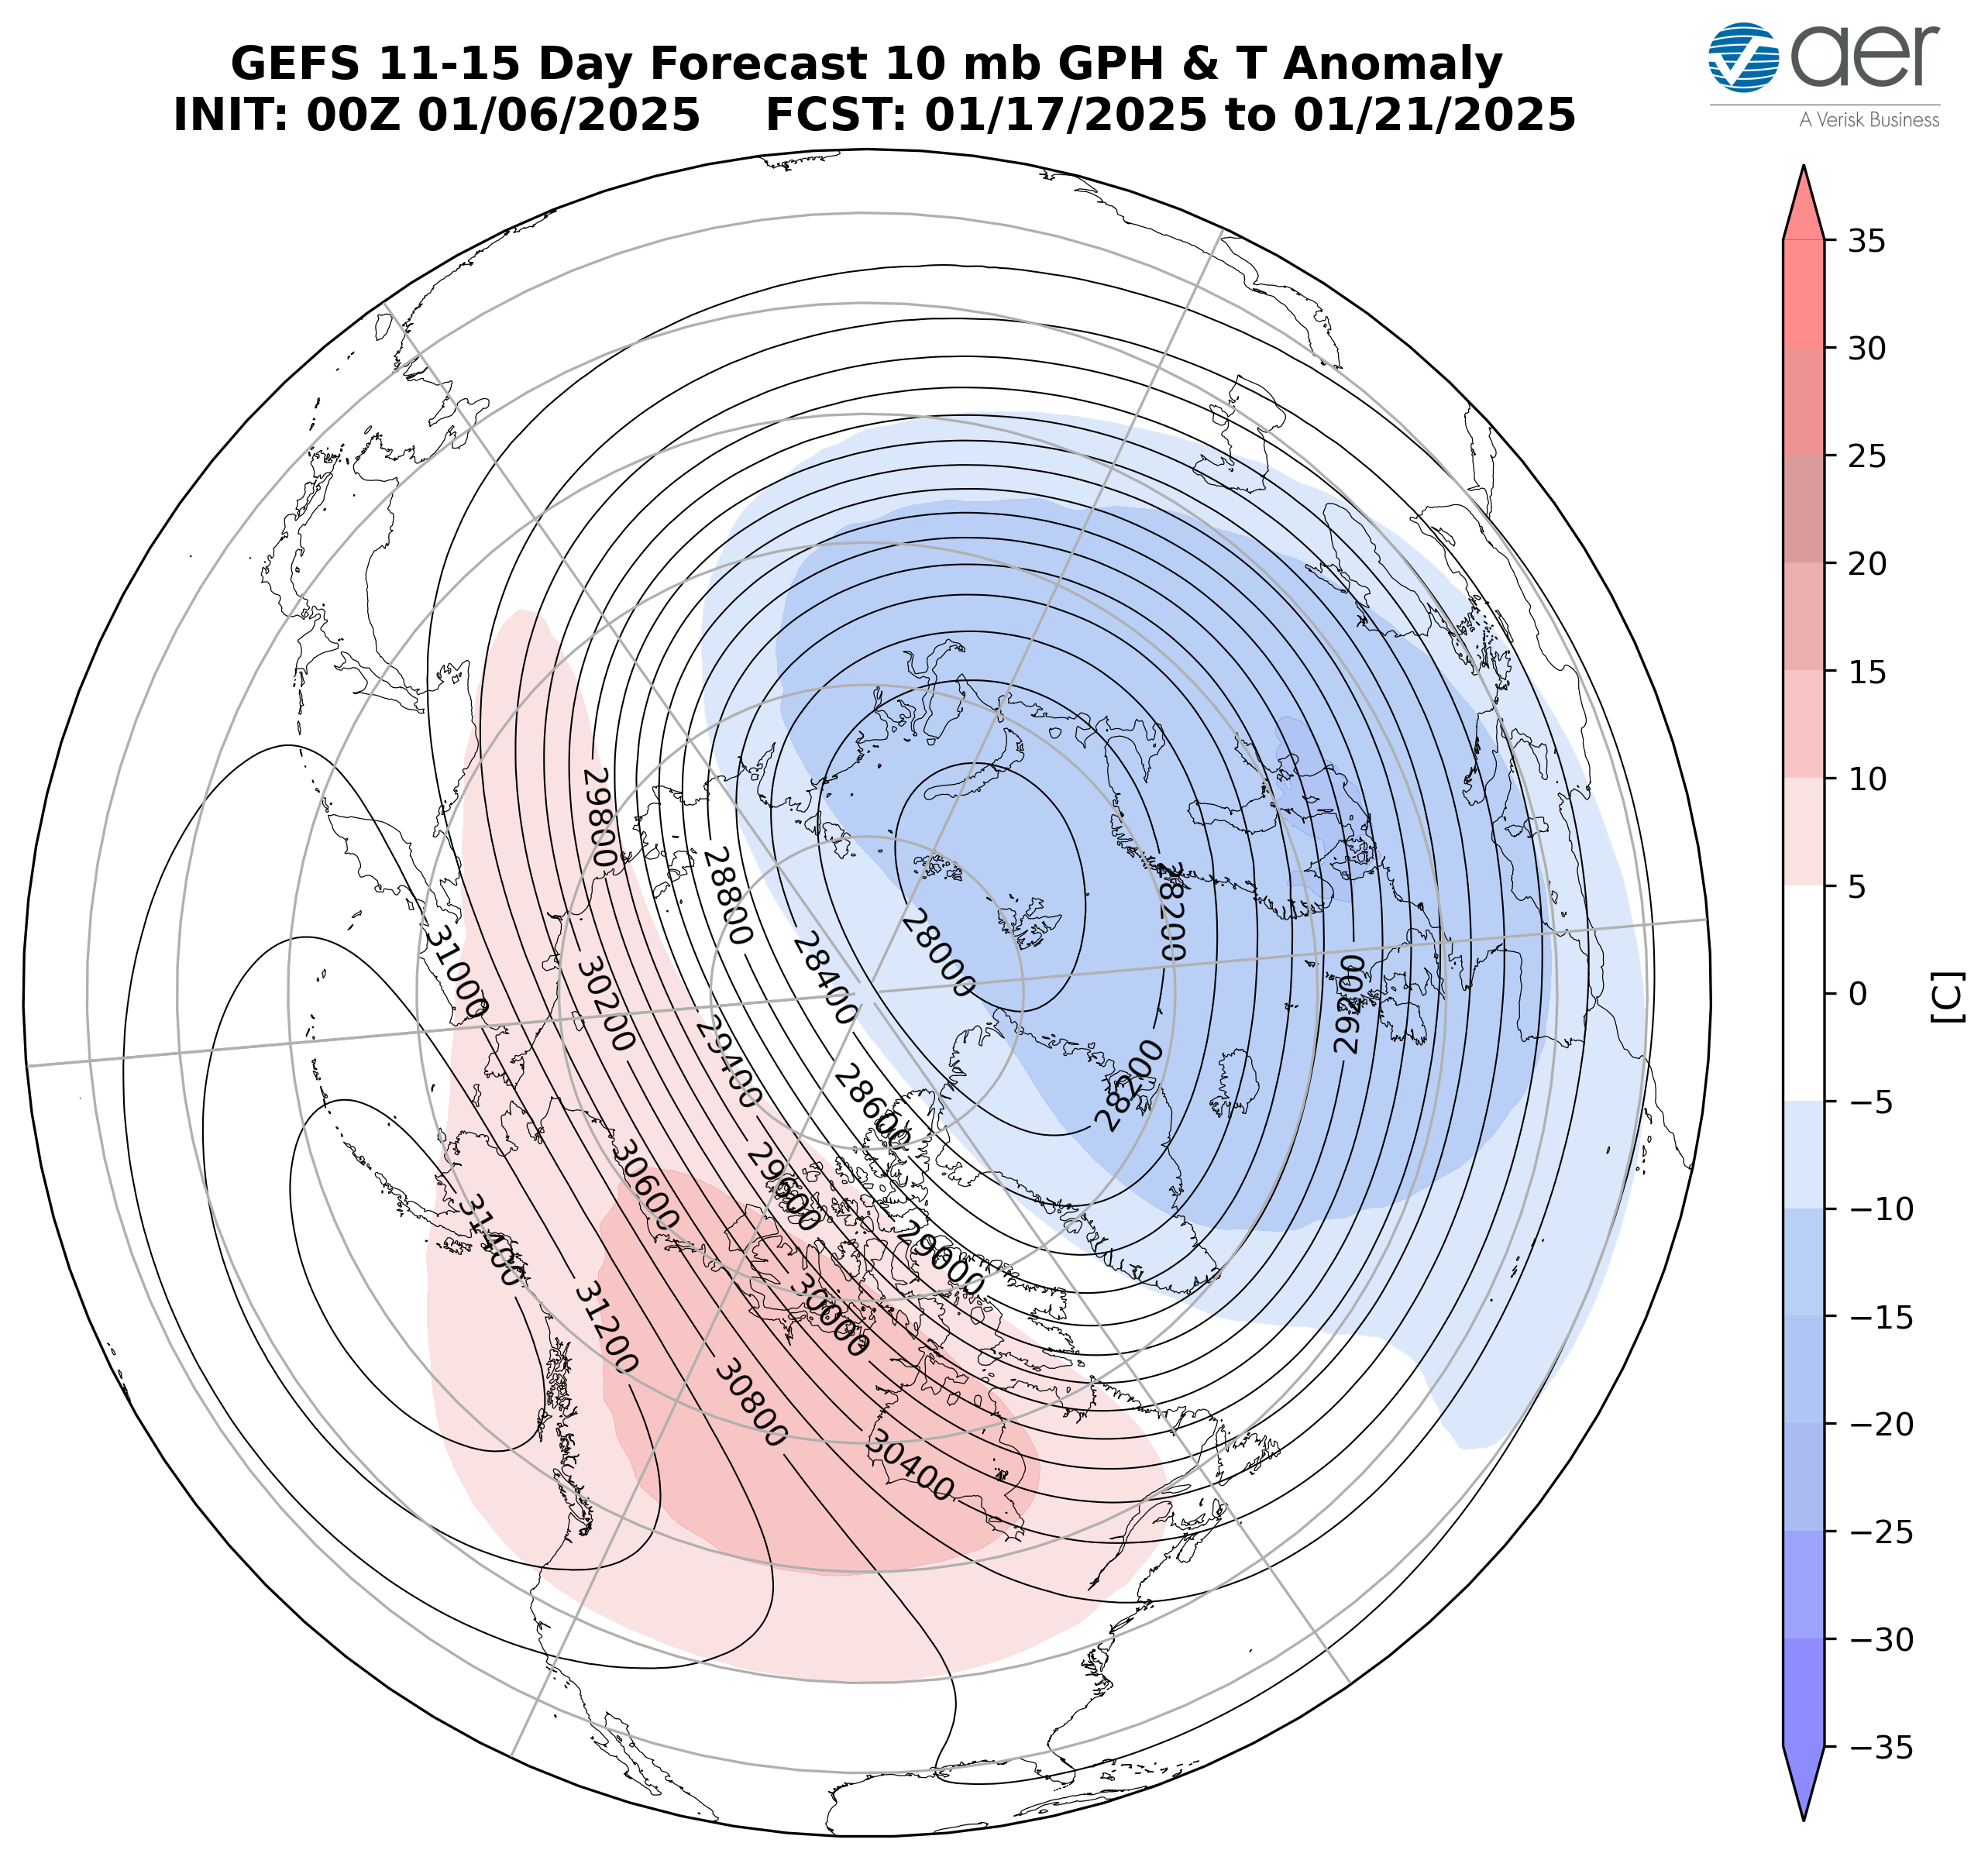
Figure 13. (a) Forecasted 10 mb geopotential heights (dam; contours) and temperature anomalies (°C; shading) across the Northern Hemisphere for 11 Jan to 15 Jan 2025. (b) Same as (a) except forecasted averaged from 16 Jan to 20 Jan 2025. The forecasts are from the 00Z 05 January 2025 GFS model ensemble.
This week the polar vortex (PV) is predicted to become more circular in shape as the PV comes out of the most recent stretched PV of early January. The greatest polar stratospheric warming is predicted over Asia pushing the PV center back over the North Pole (Figure 13a). This is often the PV phase associated with milder conditions and by next week the pattern of severe winter weather in the Eastern US should relax. Then, PV center is predicted to move closer to Svalbard and become more elongated in shape with relatively coldest temperatures across Europe in the polar stratosphere (Figure 13b). This is consistent with a yet another stretched PV (for those keeping score at home, the sixth of the season). The stratospheric AO in Figure 1 this week continues to show that despite the repeated stretched PVs and even the Canadian warming, overall the PV remains strong, and any cold air outbreaks should remain brief with each individual stretched PV event, on the order of a week or so.
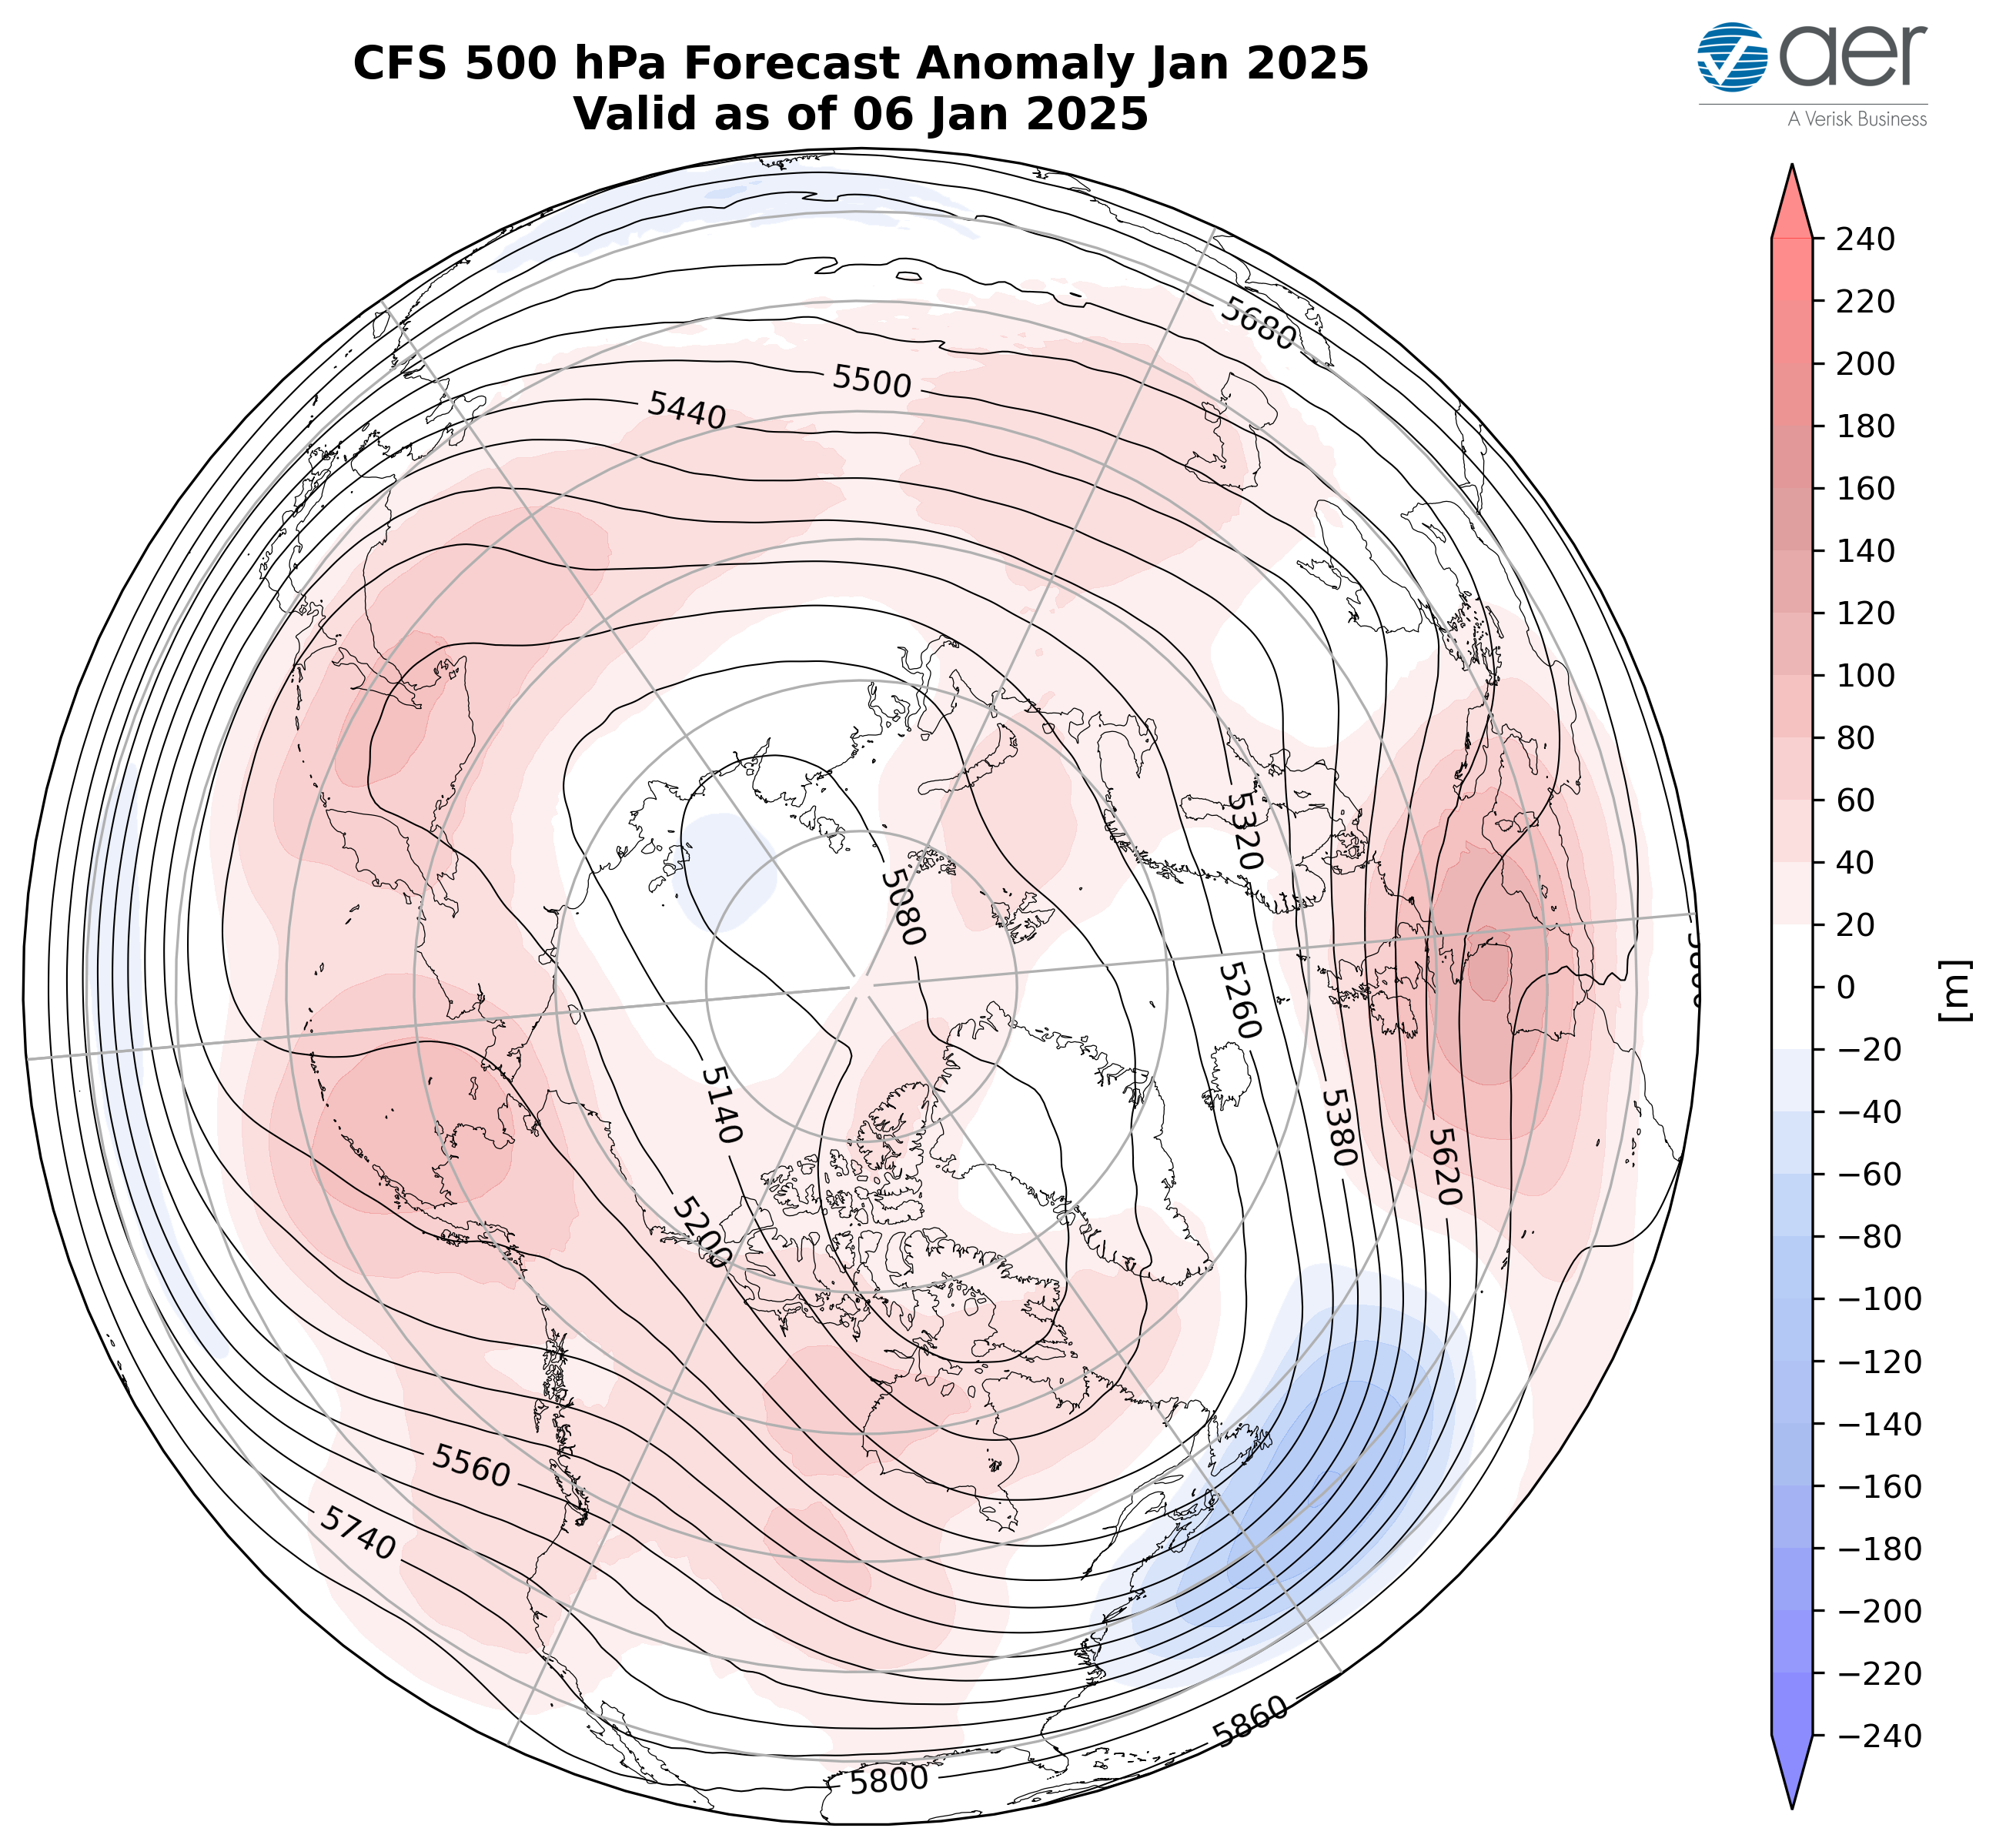
Figure 14. Forecasted average 500 mb geopotential heights (dam; contours) and geopotential height anomalies (m; shading) across the Northern Hemisphere for January 2025. The forecasts are from the 00Z 06 Jan 2025 CFS.
I include in this week’s blog the monthly 500 hPa geopotential heights (Figure 14) and surface temperatures for February (Figure 15) from the Climate Forecast System (CFS; the plots represent yesterday’s four ensemble members). The forecast for the troposphere is ridging centered on Europe, stretching from the Gulf of Alaska, Alaska, across the Dateline and into Eastern Siberia and the Southeastern US with troughing across Baffin Bay and Greenland, Northern and Eastern Asia, Western and Central Canada and the Western US (Figure 14). This pattern favors seasonable to relatively warm temperatures across Europe, Western and Southern Asia, Eastern Siberia and the Southern US with seasonable to relatively cold temperatures across Northern and East Asia, including much of Siberia, much of Canada and the Northern US (Figure 15).
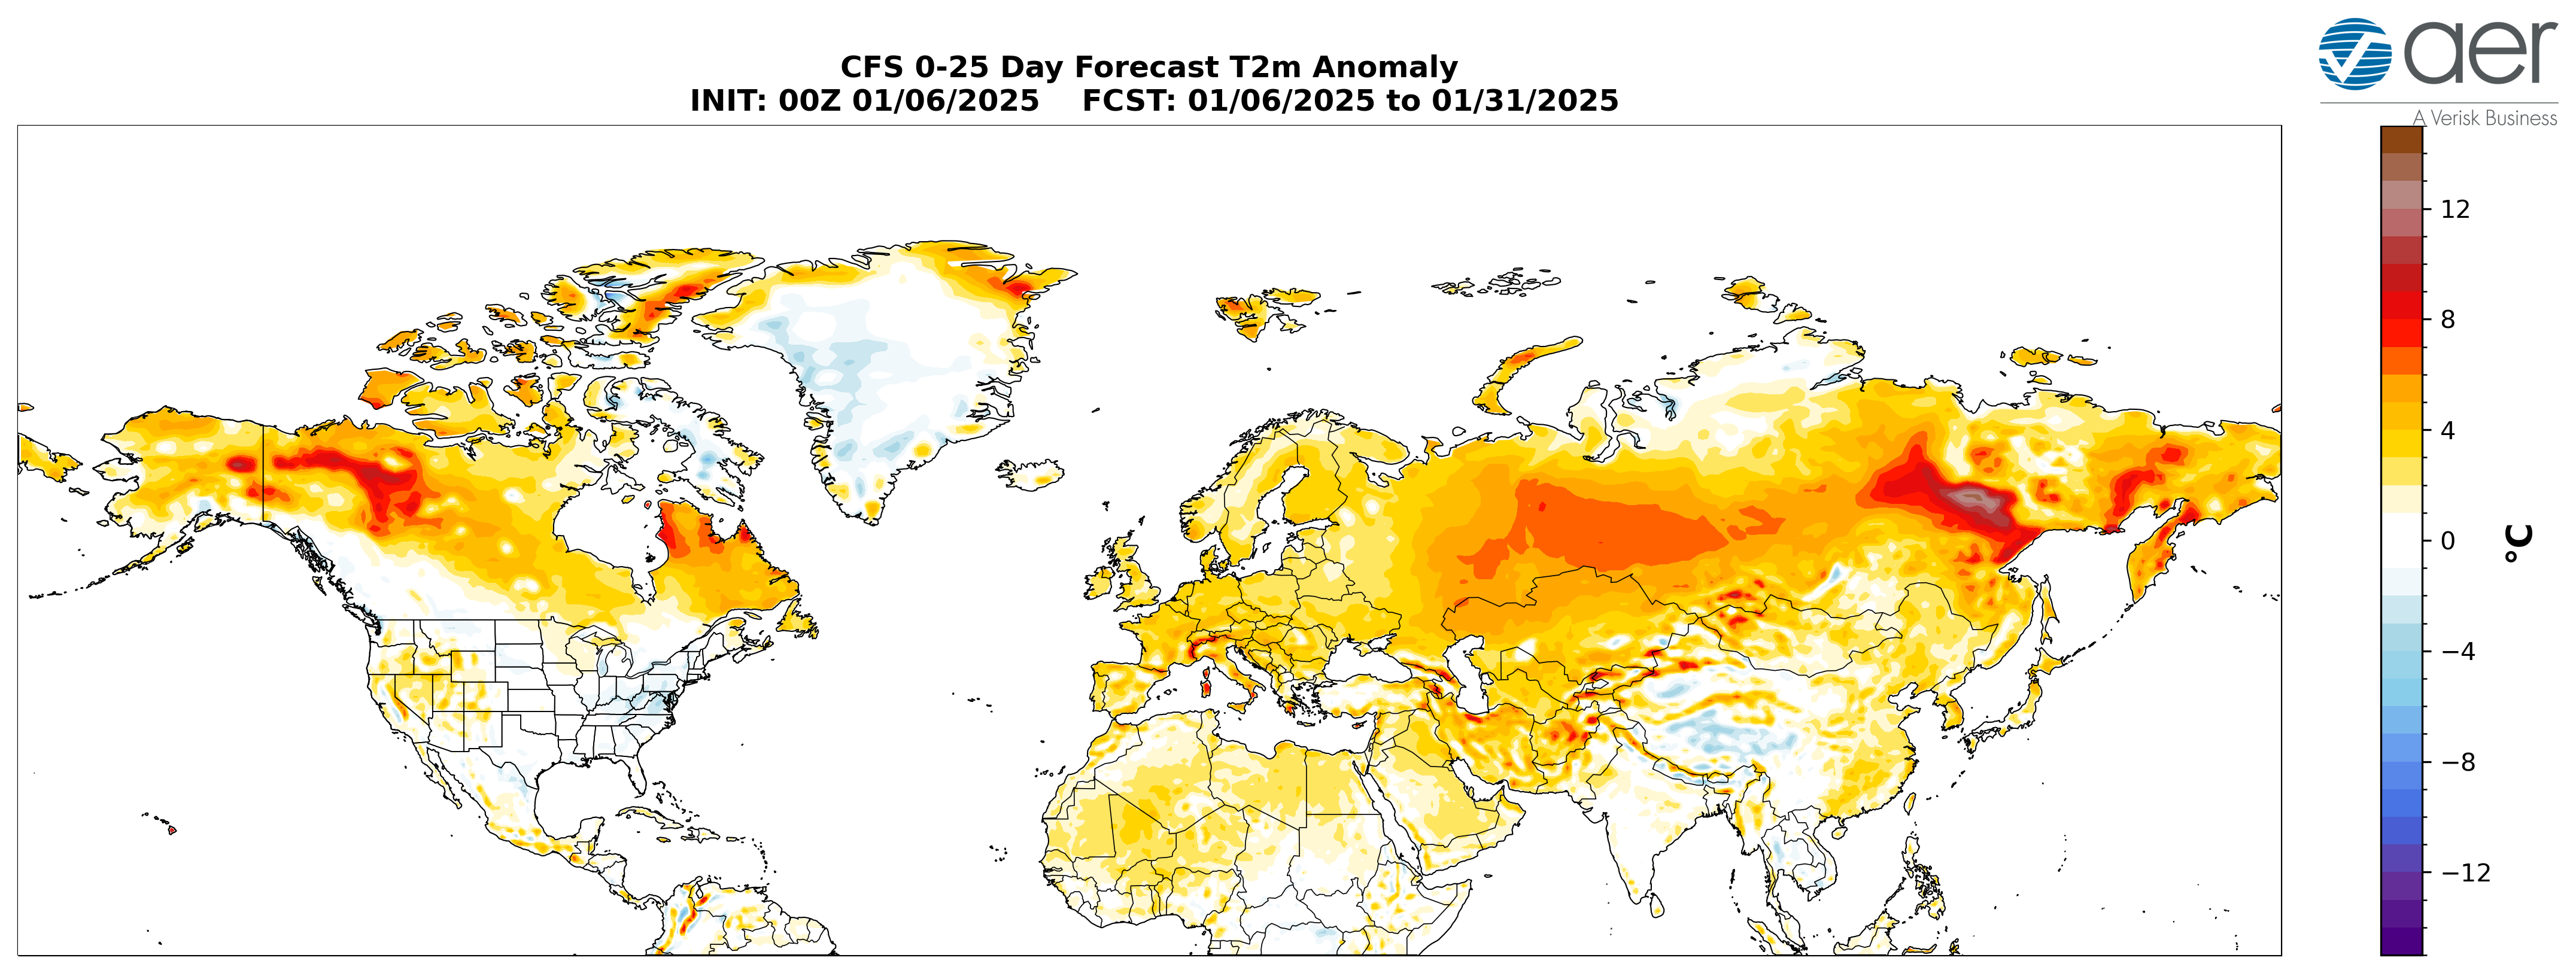
Figure 15. Forecasted average surface temperature anomalies (°C; shading) across the Northern Hemisphere for January 2025. The forecasts are from the 00Z 06 Jan 2025.
Boundary Forcings
Arctic Sea Ice
Sea ice growth continues relatively slowly with a larger negative anomaly in the North Atlantic sector compared to the North Pacific sector though reduced from during the fall (see Figure 15). This is important because it is the lack of sea ice in the Barents-Kara Seas that favors a weak PV and colder temperatures across the interior of the NH continents. The other region where sea ice is below normal is Hudson Bay. I do wonder if low sea ice extent in Hudson Bay is contributing to the atmospheric ridging and very mild temperatures over Northeastern Canada.
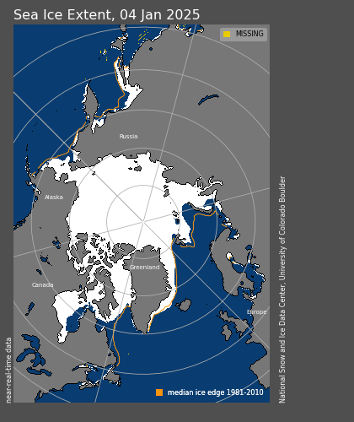
Figure 16. Observed Arctic sea ice extent on 04 Jan 2025 (white). Orange line shows climatological extent of sea ice based on the years 1981-2010. Image from the National Snow and Ice Data Center (NSIDC). URL: https://nsidc.org/sea-ice-today.
SSTs/El Niño/Southern Oscillation
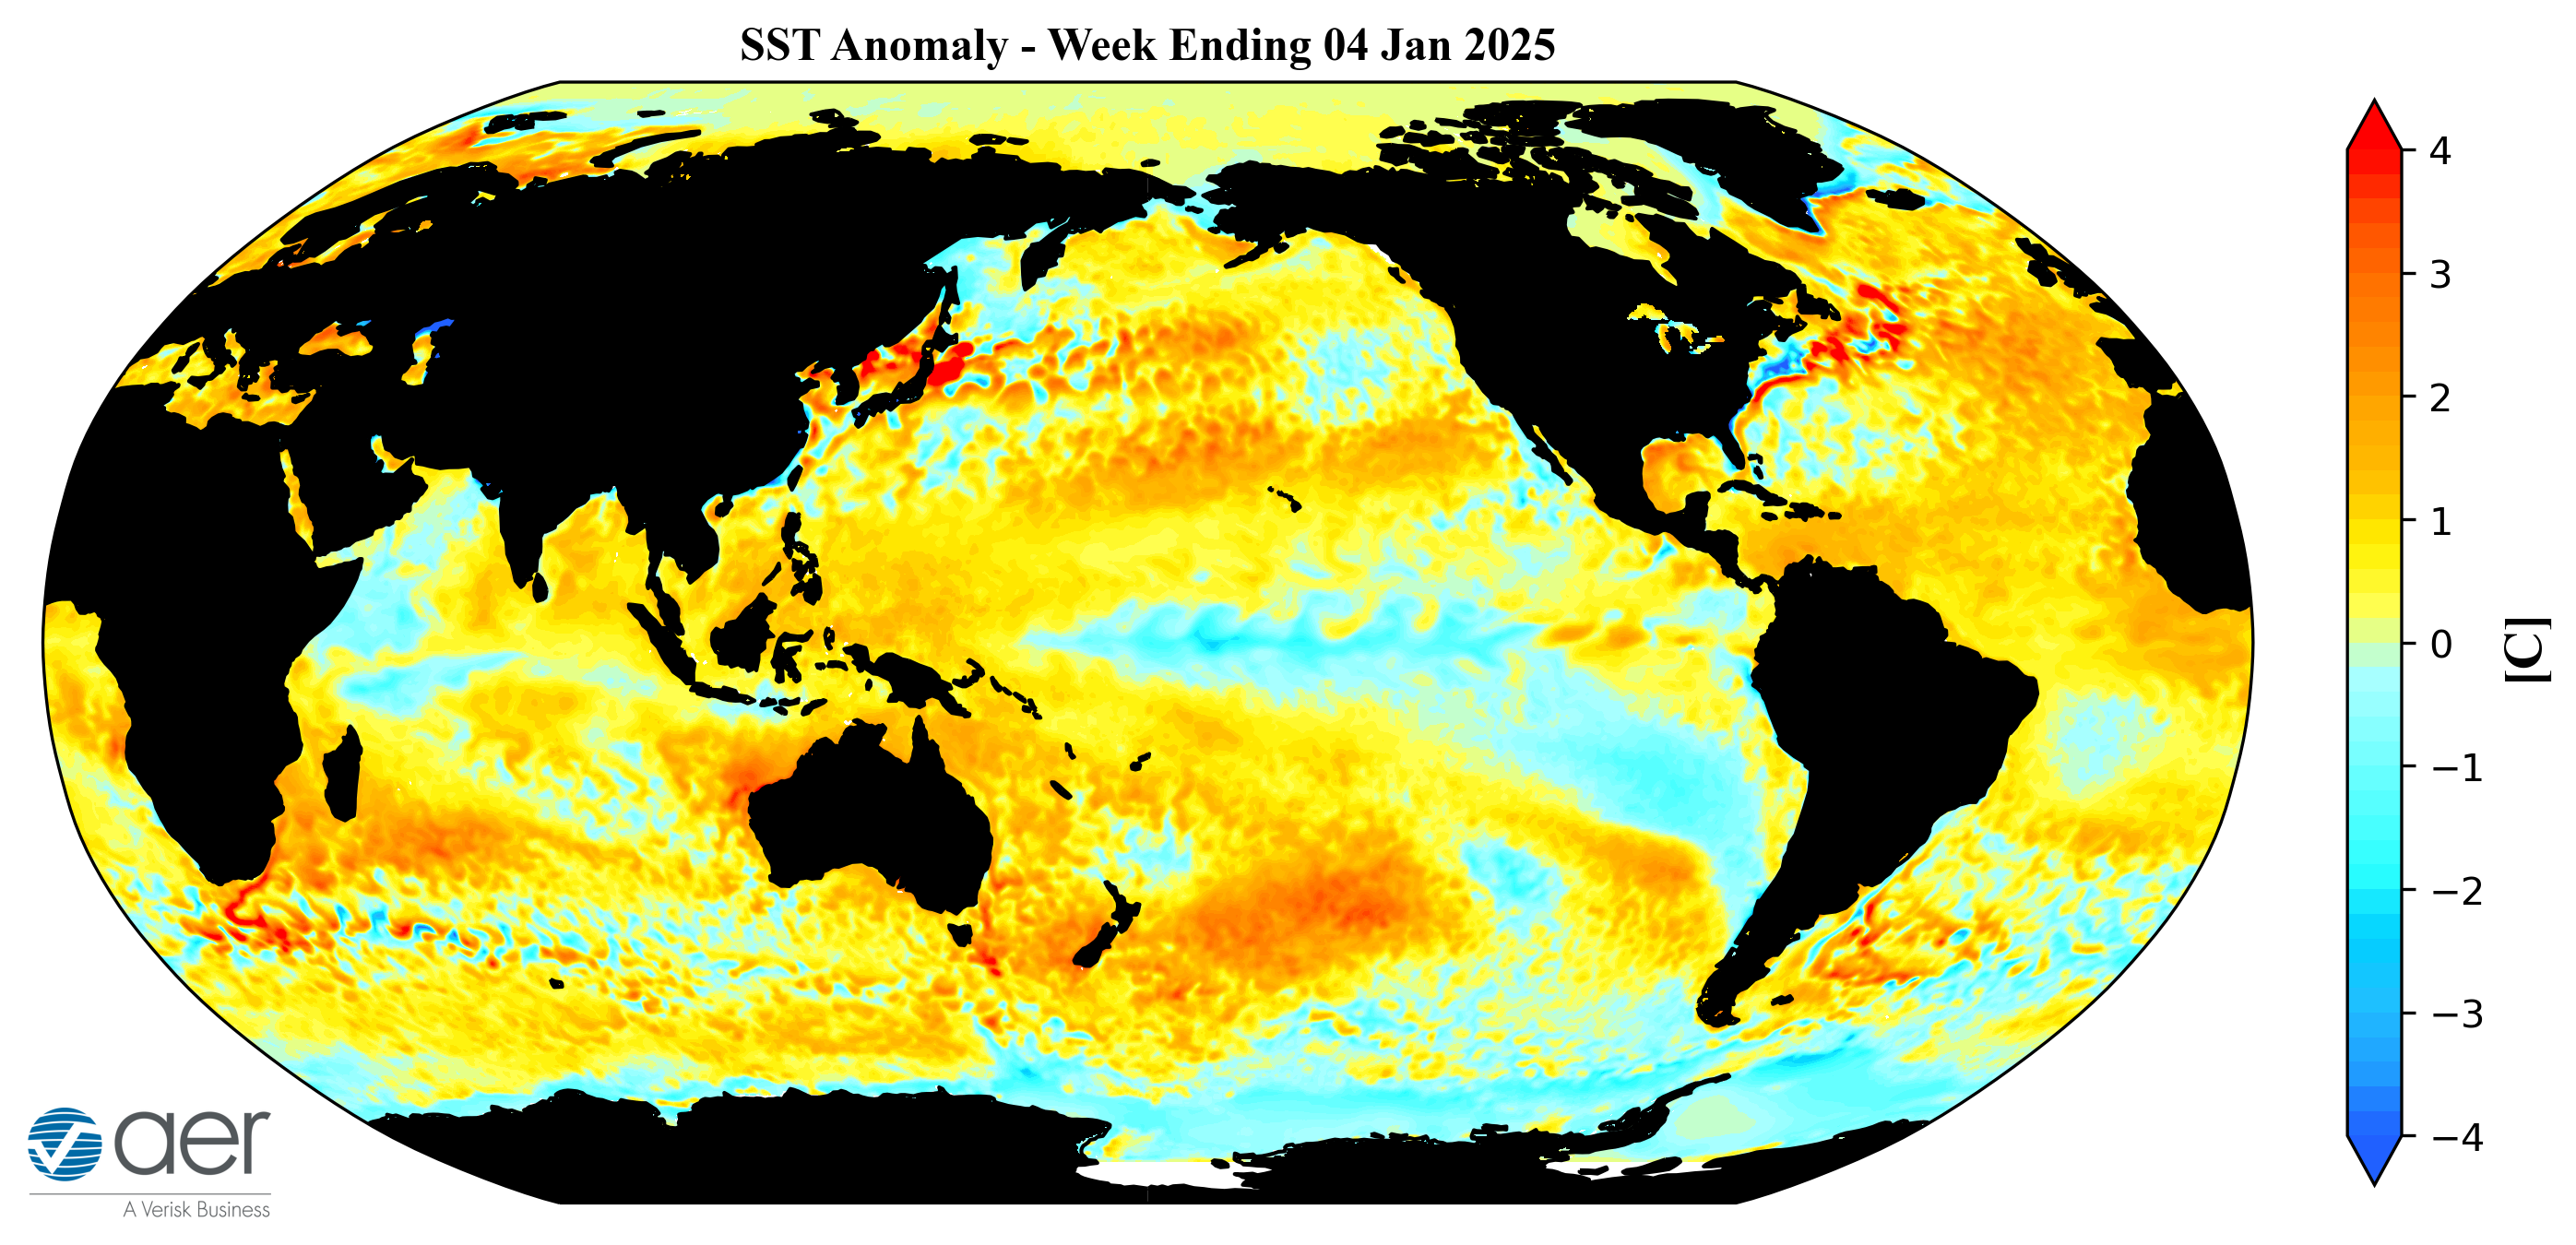
Equatorial Pacific sea surface temperatures (SSTs) anomalies are below normal, between the Dateline and the South America coast, indicating that a La Niña event is emerging (Figure 17) and weak La Niña conditions are expected through the winter. Observed SSTs across the NH remain well above normal especially in the central North Pacific centered on the Dateline and the western North Pacific, much of the North Atlantic and offshore of the Canadian Maritimes though below normal SSTs exist regionally especially in the South Pacific. I do wonder if the warmer SSTs this year relative to recent years along the west coast of North America is favoring the cold air further to the east this winter compared to the past decade.
Figure 17. The latest daily-mean global SST anomalies (ending 04 Jan 2025). Data from NOAA OI High-Resolution dataset. Source https://psl.noaa.gov/map/clim/sst.shtml
Madden Julian Oscillation
Currently the Madden Julian Oscillation (MJO) is currently in in phase seven (Figure 17). The forecasts are for the MJO to slowly make its way into phase eight and then weaken where no phase is favored and then briefly re-emerge in phase one. Phases eight and one favor ridging the Western US and troughing in the Eastern US. Therefore, it seems that the MJO may be having an influence on North American weather the next couple of weeks. But admittedly this is outside of my expertise.
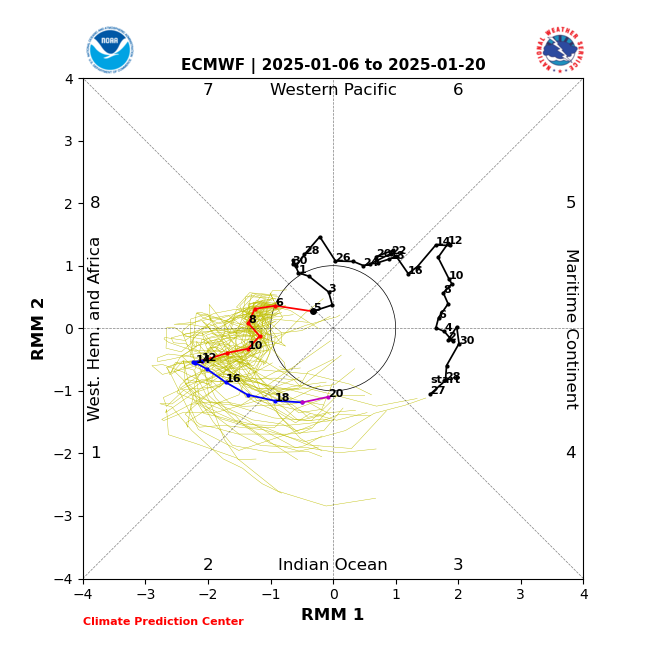
Figure 18. Past and forecast values of the MJO index. Forecast values from the 00Z 30 December 2024 ECMWF model. Yellow lines indicate individual ensemble-member forecasts, with the green line showing the ensemble-mean. A measure of the model 'spread' is denoted by the gray shading. Sector numbers indicate the phase of the MJO, with geographical labels indicating where anomalous convection occurs during that phase. Image source https://www.cpc.ncep.noaa.gov/products/precip/CWlink/MJO/CLIVAR/ecmf.shtml
Get Detailed Seasonal Weather Intelligence with sCast
We appreciate your taking the time to read the public Arctic Oscillation blog from Dr. Judah Cohen and the AER Seasonal Forecasting team.
Dr. Cohen’s detailed monthly seasonal forecast, sCast, is also available for purchase. sCast provides a monthly 30-60-90-180-day outlook into temperature and precipitation, solar flux and wind anomalies across the globe, and regional population weighted cooling and heating degree forecasts for the US.
Our sCast principal engineer, Karl Pfeiffer, can help you use sCast and other AER seasonal forecast products to deliver important, long-lead time weather intelligence to your business. Please reach out to Karl today!




 (click image to play)
